You typically use the LuciadRIA RIAMap component to visualize and edit data with a geospatial reference.
You can also visualize data without a geospatial reference by setting a Cartesian reference.
Use cases for non-geospatial views in 2D and 3D
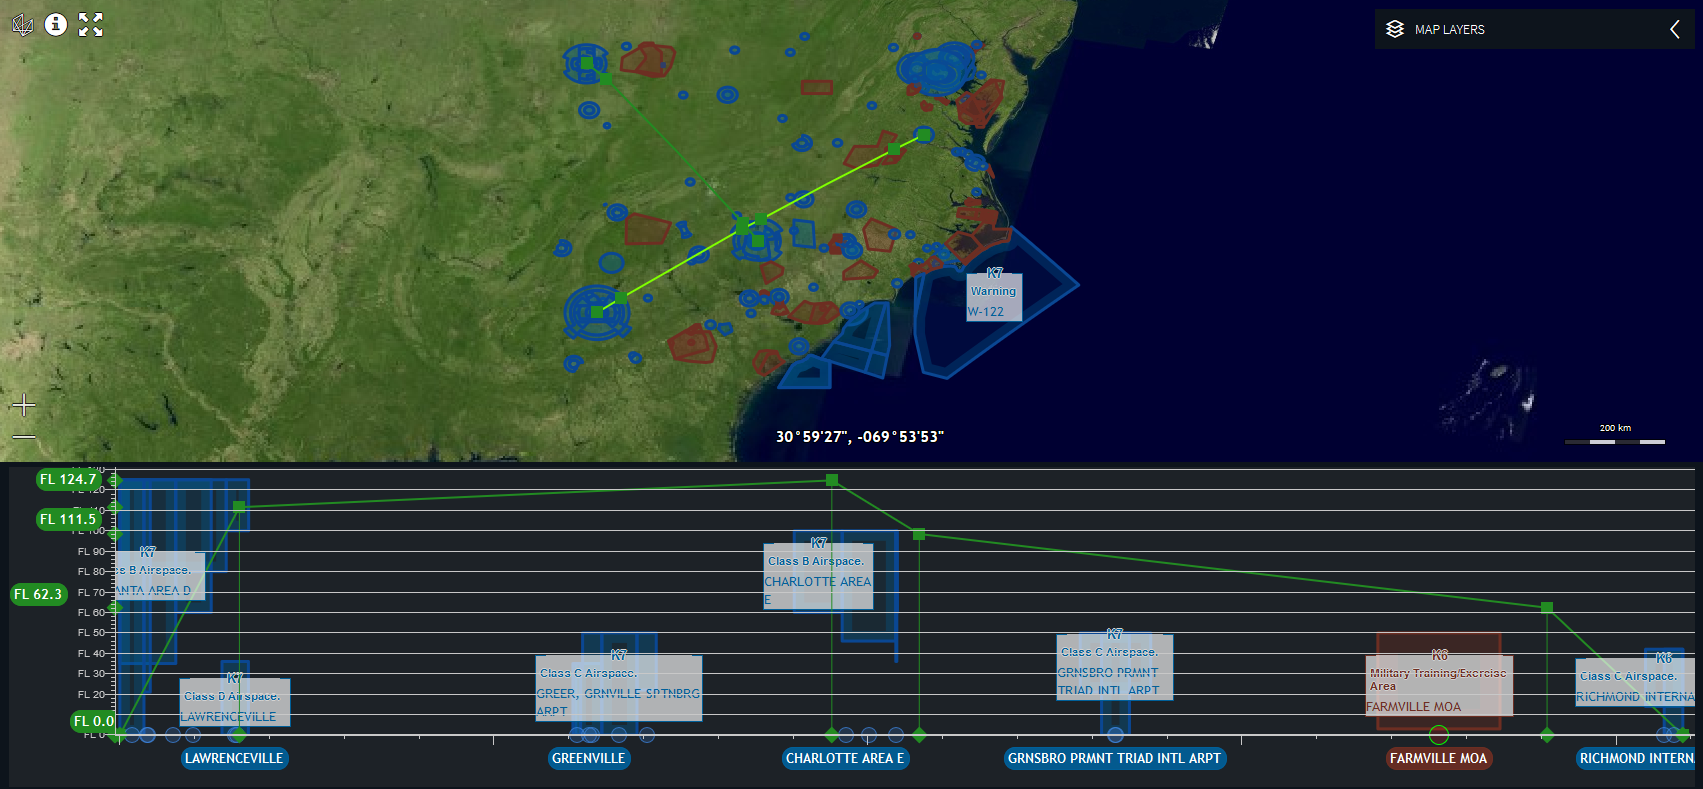
Possible two-dimensional use cases include the creation of scatter plots or the creation of vertical views, which represent distance and height on their axes. See the LuciadRIA vertical view sample for an example of an implementation.
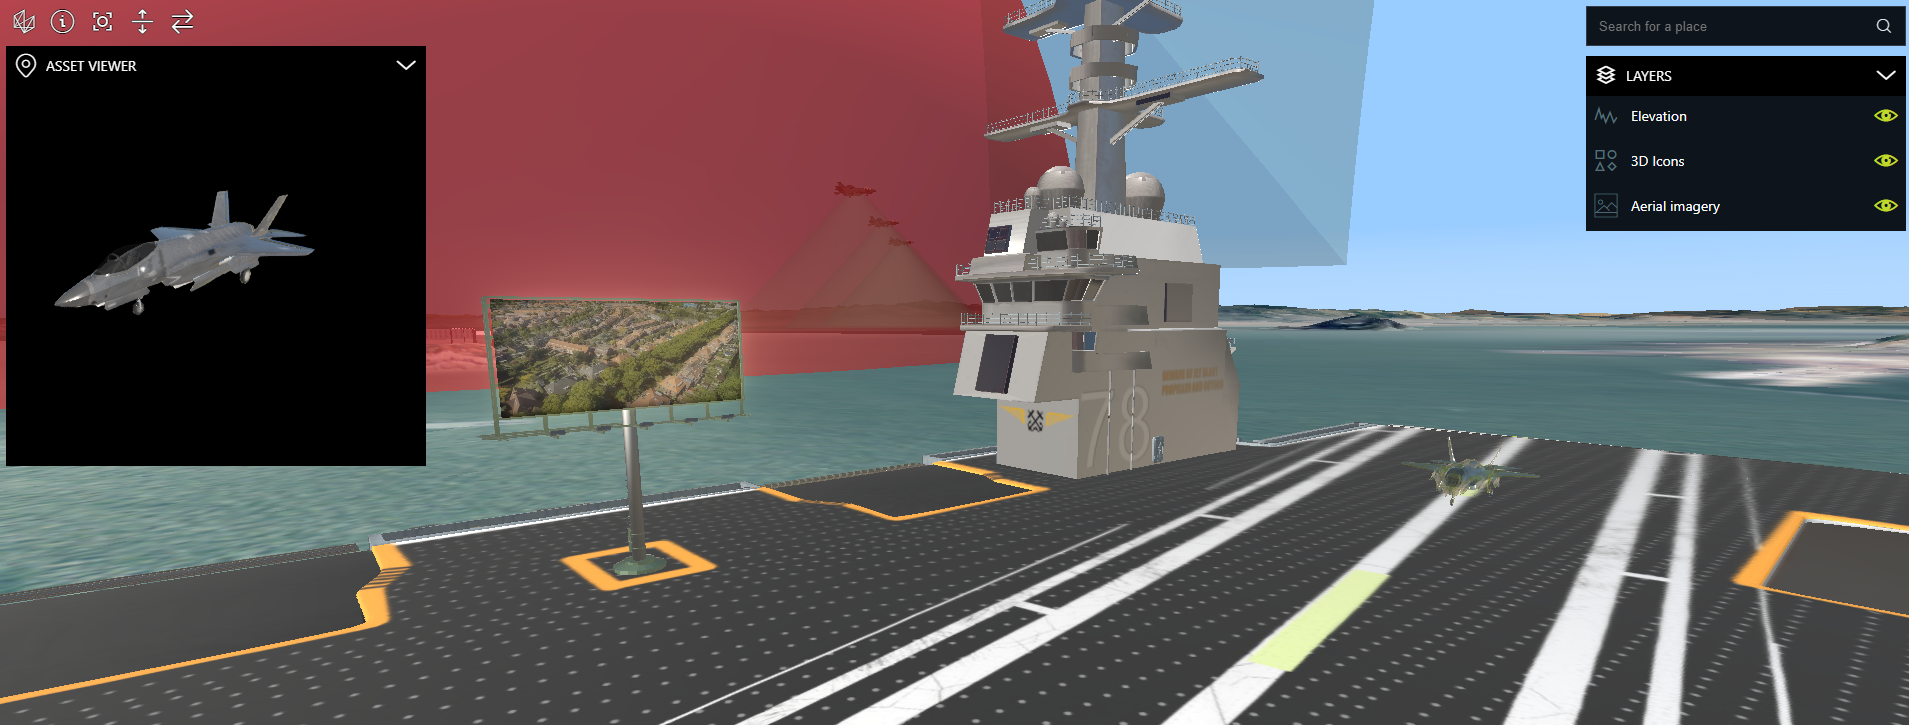
A possible three-dimensional use case is an asset viewer. In an asset viewer, users can visualize a single asset without a globe, in its own local coordinate system. See the LuciadRIA 3D icons sample for an example of an implementation.
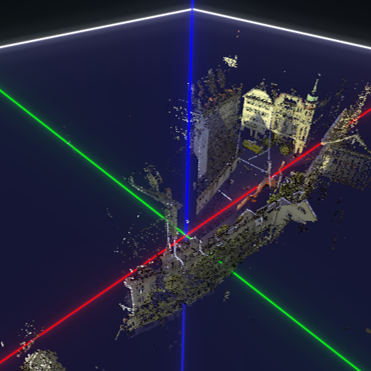
A 3D Cartesian RIAMap is especially beneficial for data that has no geolocation, for example a LIDAR scan or a CAD model of a building that hasn’t
been georeferenced yet. Figure 3, “Point cloud Cartesian” shows you a non-georeferenced point cloud visualized in its local, Cartesian 3D reference.
A 3D Cartesian RIAMap also supports the use of a 3D orthographic camera, as opposed to the perspective camera that LuciadRIA normally works with.
This type of camera is commonly used in CAD applications.
It shows your assets in an isometric view, which allows you to compare the relative size and angle of objects, regardless
of their distance to the camera.
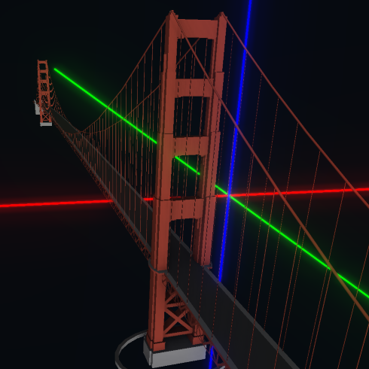
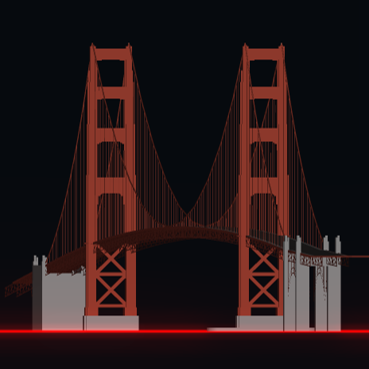
Figure 4, “3D Cartesian perspective” shows you a 3D Cartesian view with a perspective camera. Notice how the tower in the background appears much smaller than the one in the foreground.
Figure 5, “3D Cartesian orthographic” shows you the same scene as Figure 4, “3D Cartesian perspective”, but with an orthographic camera. Notice how both towers are the same size, regardless of their distance from the camera. This makes it easier to compare relative sizes and angles
Using a non-geospatial view
You can use a non-georeferenced map in LuciadRIA in the same way as a georeferenced RIAMap: a non-georeferenced map just has a Cartesian reference instead of a georeference.
Because only the reference is different, the API to visualize data on a non-georeferenced view is the same.
Re-using the LuciadRIA map instead of introducing a third-party library has its benefits. It means that you can use all existing
LuciadRIA map features: you can add more than one layer, select and edit elements, add labels, and declutter labels. You can
also re-use the existing controllers, painters, and label painters, and even the models. See the vertical view sample for
an illustration. It adds regular FeatureLayer instances configured with a FeaturePainter to the vertical view.
To visualize data in a non-georeferenced view, you need to:
-
Create a Cartesian reference for your view
-
Add your data to the Cartesian view
Creating a Cartesian reference
A Cartesian reference is a CoordinateReference that uses a Cartesian coordinate system: a tuple of numerical coordinates specifies each point uniquely in a coordinate system.
These are the signed distances from the point to three fixed perpendicular axes X, Y and Z.
In LuciadRIA, all axes of a Cartesian reference are associated with a quantity, such as a length or a weight. They’re expressed
in a unit of measure, such as meters or kilograms.
|
LuciadRIA has two built-in 2D Cartesian references. You can use them as a model reference and/or a map reference.
You can also use the built-in 3D Cartesian reference |
You can create a Cartesian reference with the ReferenceProvider.createCartesianReference method.
You must specify the unit and quantity for each of the axes by passing a UnitOfMeasure instance for each axis.
See
Program: Creation of a Cartesian reference.
samples/verticalview/verticalview/VerticalViewBorderOptions.ts)
const X_AXIS_UOM = getUnitOfMeasure("NauticalMile");
const Y_AXIS_UOM = getUnitOfMeasure("FlightLevel");
export const VERTICAL_VIEW_REFERENCE = createCartesianReference({
  xUnitOfMeasure: X_AXIS_UOM,
  yUnitOfMeasure: Y_AXIS_UOM
});
A UnitOfMeasure is associated with a certain type of quantity, and indicates in which unit this quantity is expressed.
You can’t create instances of this class directly.
You must retrieve them from the UnitOfMeasureRegistry class.
For more information, see the reference documentation of those classes.
Adding data to a Cartesian view
A LuciadRIA map is capable of visualizing the data of models with different references. Those model references may be different from the reference of the map itself. The map takes care of the conversion of the model reference to the map reference if both references are compatible. This automatic conversion applies to both georeferences and Cartesian references.
When are references compatible?
Two Cartesian references are compatible when:
-
The X-axes of both references represent the same type of quantity
-
The Y-axes of both references represent the same type of quantity.
-
If there are any, the Z-axes of both references represent the same type of quantity.
Examples of quantity types are physical quantities like distance, weight, or time. Each axis may represent a different type of quantity. Although the quantity type for each axis must be the same in both references, you can express them in distinct units of measure.
Consider two compatible references A and B. In both, the X-axes represent distance and the Y-axes represent time.
Reference A expresses distance in meters, while B expresses it in feet.
Even though the units of measure differ, A and B are still compatible.
This means that you can add a model with reference A to a RIAMap with reference B.
All georeferences that LuciadRIA supports, are compatible. That means that you can add any model with a georeference to a georeferenced map, with a correct data visualization as a result.
Dealing with reference incompatibility
LuciadRIA maps also support scenarios in which the model reference is incompatible with the map reference.
The main goal is to share a model between maps with distinct references, for example between a georeferenced map and a vertical view. Sharing a model between maps has the benefit that you can visualize updates to the model on both maps. The consequence is a model reference that’s incompatible with the reference of the map, though.
To support such a scenario, you must configure the FeatureLayer with a ShapeProvider.
The ShapeProvider provides shapes in a reference that’s compatible with the map reference.
The shape provider must create a new shape for each of the Feature instances in the model.
It must define the new shape in a reference that’s compatible with the map reference, and that matches the reference of the
ShapeProvider.
The map displays the shapes returned by the ShapeProvider.
The FeaturePainter receives the original Feature contained in the model and the shape returned by the ShapeProvider in its paintBody method.
You can still access the original shape through the Feature.
|
You don’t need to make the reference of the |
The vertical view sample demonstrates two example ShapeProvider implementations: the AirspaceShapeProvider and TrajectoryShapeProvider classes.
|
You only need a |
Limitations and conventions for 3D Cartesian references
When your map has a 3D Cartesian reference, you can visualize various (potentially 2D) shapes on the map. Because it’s a 3D non-geospatial map, certain concepts that are applicable to geocentric maps may not have the same meaning on 3D Cartesian maps. Therefore, you must consider certain limitations and conventions with those maps.
-
These are limitations and conventions related to references:
-
The reference of the model data and the map must be equal or compatible. Geospatial references are never compatible with Cartesian references.
-
Automatic conversions between Cartesian references and geospatial references are not supported.
-
The X-axis of the map’s coordinate system serves as the east direction, the Y-axis as the north direction and the Z-axis as the up direction where applicable. This is the case for
LookAtandIconStyle.heading, for example.
-
-
Some limitations and conventions apply because there is no Earth — so no terrain, no ellipsoid, nor an atmosphere — on the map in a Cartesian reference:
-
Raster layers are not supported.
-
Draping has meaning on geocentric maps but doesn’t mean anything on 3D Cartesian maps. Any drape styling is ignored, the data is always styled with
DrapeTarget.NON_DRAPED. -
When you’re using
RIAMap.getViewToMapTransformation, the Z = 0 plane takes on the role of terrain and ellipsoid. So, for the corresponding location modes, the transformation yields a world point position on the Z = 0 plane. -
The above-terrain navigation constraint is not supported.
-
Above-terrain icons are not supported.
-
The starfield graphical effect is disabled by default. You can still enable it if you want to.
-
The
atmospheregraphics effect is not supported.
-
-
These are limitations and conventions related to cameras:
-
LookAtandLookFromuse the axes directions to define yaw and pitch. -
The depth range is not automatically adjusted, because the default
RIAMap.adjustDepthRangesetting is false on 3D maps with a Cartesian reference. You can still enable depth range adjusting if you want to. It then uses z-values as "terrain" height. -
The lack of automatic depth range adjusting also means that the camera may need near and far values that are tailored to the application specifically. If the data uses very large coordinates for example, the far value must increase to ensure all objects are properly in view. The near value may have to increase too.
-
3D orthographic cameras are supported.
-
Visualizing and decorating Cartesian map borders
You can enhance a Cartesian map by adding borders that display axes or custom drawings.
The map-borders toolbox component makes it easy to create and manage these borders around your map.
With it, you can:
-
Add borders on any side of the map (top, bottom, left, right).
-
Display axis lines, tick marks, and labels along those borders.
-
Render any custom content, such as shapes or labels.
For implementation details and examples, see the dedicated article How to draw a map with borders.
You can also check the code of the Vertical View sample, which demonstrates how to use bordered maps with custom axes and decorations.
Fitting tightly around the data in a Cartesian view
After a map fit, you may end up with excess space on a LuciadRIA map with a non-geographic reference. The default LuciadRIA map fit leaves some padding around the axes in a Cartesian view. It also preserves the scale ratio between the X and Y axes before and after the fit. To remove any excess space, see How to fit on bounds so there is a tight fit around the data.