About this release
The 2026.0 release of LuciadRIA introduces several new features and improvements designed to enhance user experience and application performance. This document provides an overview of the key updates in this release.
2D non-WebGL map end of life announcement
LuciadRIA was released in 2012 with a 2D map based on an HTML5 Canvas. In 2016, the WebGL-powered hybrid 2D/3D map was introduced, leveraging WebGL support in most browsers. Moving forward, we will focus solely on hardware-accelerated maps. Hardware-accelerated maps offer all the capabilities of non-WebGL maps and bring much more to the table.
The 2025.0 release marked the end of the non-WebGL Canvas Map in favor of the hardware-accelerated WebGL Map only. The 2025.0 release was the last one to contain the 2D Canvas Map.
The 2026.0 release effectively marks the end of life for non-hardware-accelerated 2D maps.
The 2025.0 version of LuciadRIA will be actively maintained until the release of version 2028. Contact the Luciad Product Management team at product.management.luciad.gsp@hexagon.com if you plan to extend your maintenance on LuciadRIA 2025 beyond 2028 so we are aware of your project.
You can find more information here.
Benefits of the new features
WebGPU support
LuciadRIA 2026.0 introduces support for WebGPU, the new standard for high-performance graphics and computation on the web. This transition replaces WebGL as the underlying graphics API, as WebGL is no longer receiving major updates and does not align with modern GPU architectures. WebGPU provides a more efficient and future-proof solution that enables enhanced graphics capabilities for web applications.
The introduction of WebGPU future-proofs your LuciadRIA applications as it gains widespread support from major browsers and industry stakeholders and abstracts native APIs such as Vulkan, Metal, and DirectX. This adoption facilitates enhanced performance, reduced overhead, and the potential for more complex features. It positions LuciadRIA for the next generation of graphics technology, offering better long-term stability and performance for web environments.
WebGPU has been introduced under the hood. This means that, except for a few well-documented upgrade considerations, this change has no impact on your code. You can find the upgrade considerations in the release notes.
Secure context
WebGPU requires a secure context to function. As a result, LuciadRIA applications must be served through HTTPS starting from this version. This change enhances the security of web applications, protecting data integrity and user privacy.
|
If you serve your applications locally, you are meeting this requirement, as |
Sample code/documentation to get you started
The documentation contains information on how to set up a secure context for your LuciadRIA applications. You can find more details here.
Military Symbology editing improvements
LuciadRIA 2026.0 introduces several enhancements to military symbols editing, including:
-
The creation of military symbols by template
-
The customization of editing handles, through the formatting and styling of handle width and radius for example.
-
Improved user experience when editing Military Symbols based on circles, ellipses, rectangles, and buffers.
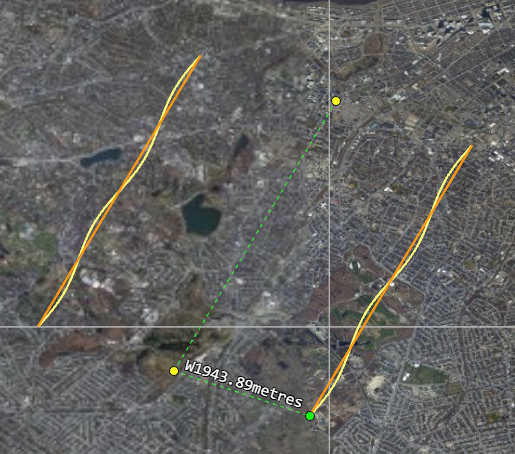
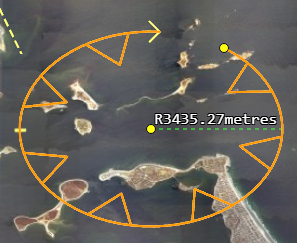
These improvements streamline the process of creating and modifying military symbols, making it more efficient and user-friendly.
Other improvements
- Moving the map borders to the LuciadRIA Toolbox
-
The map borders feature has been re-located from the LuciadRIA API to the LuciadRIA Toolbox, giving you full control over the integration of map borders into your own code and over any customizations. In addition to this architectural change, the map borders feature now leverages hardware acceleration, resulting in improved rendering performance and enhanced visual quality. From a functionality perspective, the feature has been extended to support adding a map border to the right side of the map, in addition to the previously supported positions.
- Adding the infinite grid to the LuciadRIA Toolbox
-
Another new tool in the LuciadRIA Toolbox is the infinite grid. The infinite grid is a customizable grid that extends infinitely in all directions, providing a reference framework for spatial orientation and measurement on the map. The grid is GPU-accelerated and supports both Cartesian and geocentric references.