About this release
The 2022.1 release of LuciadRIA focuses on Developer Experience. We updated the controller and editing API, allowing to offer intuitive and tailored map interaction specific to your application. In 3D, you can now offer a richer operational picture thanks to the introduction of draping of vector data over meshes, instancing of 3D icons, and bloom effects to attract the user’s attention to important elements on the map. This release also offers extended Open Geospatial Consortium (OGC) Symbology Encoding (SE) support for precisely styling vector data, following a given style guide.
Benefits of the new features
Intuitive map interaction using updated map controller and editing API
Based on feedback we gathered from our many LuciadRIA developers, we are pleased to announce that for the 2022.1 release, we updated the LuciadRIA map controller and editing API and added extra documentation. These updates cover a set of topics that we list here in arbitrary order.
Interaction with the map
First, we added documentation on the default behavior of the map both with mouse and touch device input.
Then, we improved customizing this default behavior. While it was already possible to add custom controllers, we now added API that exposes the default controllers, such as the pan and zoom controllers, so that you can extend them. Also, there is a new composite controller for chaining controllers. These are only a few examples, but the complete set of changes ensures that you can tailor the map interaction to your project needs. These new API additions will reduce the custom development needed to reach the required behavior.
Add Undo/Redo support for on-map editing to your application
When users need to do on-map editing of data, undo/redo support is very convenient. To this end, LuciadRIA now offers new
API with the concepts Undoable and UndoManager. The exact behavior of your system will depend on your users’ specific needs. Therefore, LuciadRIA doesn’t make any assumptions
about how undo/redo works in your application. You decide when to create Undoables, what they do, and how they’re managed.
We provide documentation, samples, and articles to help you make the right decisions.
Fine-grained tweaking of feature creation and editing
LuciadRIA introduces new API to customize creation and editing behavior. The new Editor and EditHandle concepts give fine-grained access to the way how features or shapes should be created and edited on the map. Users can implement
a custom editor or extend from one of the many out-of-the-box implementations available for LuciadRIA’s shape types. The new
API enables a wide range of use cases, including:
-
Restricting editing operations such as disabling translation or only allowing to move the individual points of a trajectory.
-
Synchronizing editing changes between the map and a user interface widget, showing shape properties like the coordinates of an area of interest.
-
Customizing the look of editing handles or the cursors.
-
Constraining editing, such as limiting the width of a buffer (corridor) shape.
-
Changing the minimum and maximum height of extruded shapes.
-
Supporting the creation and editing of custom shapes.
Sample code to get you started
For the new undo/redo capability, the samples show you examples of use cases, such as undo/redo for selection, creation, editing, and removal of features. More specifically:
-
The module
toolbox/ria/core/util/SampleUndoSupportimplements commonly used undo/redo operations in LuciadRIA samples, such as undo/redo for selection, creation, deletion, and editing of features. -
The “Create and Edit” sample shows you how to wire undo/redo buttons in the UI to an UndoManager.
-
The “Geolocate” sample illustrates how to use the undo/redo API with a custom controller implementation.
To illustrate the new feature creation and editing capabilities, we extended the “Create and Edit” sample with a “Custom Editing” theme. This theme shows how to implement use cases such as disabling translation, disabling editing for selected points of a shape, and creating a custom arrow shape with helper lines and constraints.
We created or extended the following articles to explain the new features and how they fit together with existing capabilities:
A rich 3D operational picture
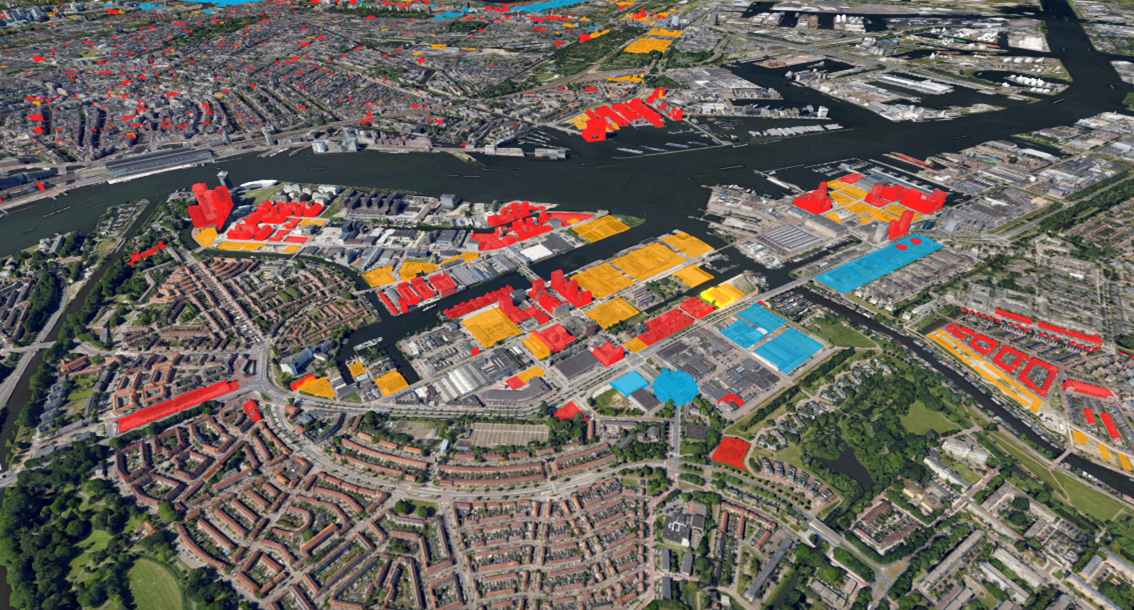
LuciadRIA offers many capabilities to represent a digital twin of either your city, site, or theater of operations. Whether you have 3D meshes, point clouds, panoramic imagery, live tracks, or more, you can bring them together into one single view. What’s next? Let’s go back to use cases. One use case is that of the operational picture (OP). The key element in an OP is bringing relevant information together, combined in such a way that a human operator can come to conclusions by looking at the combined information. With this release, we focus on elements that improve the OP. We selected draping vector data over 3D meshes, instancing of 3D objects, and bloom effects.
Combine 2D features with 3D meshes data sets via draping
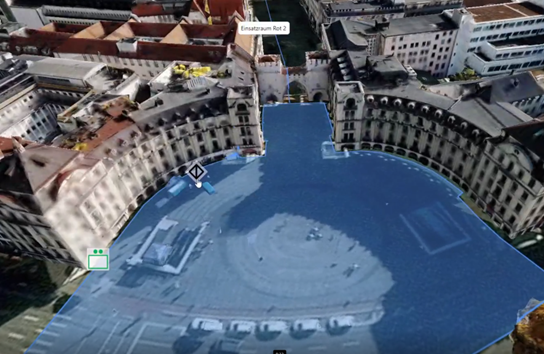
Once the digital 3D model loads into your 3D view, you can augment it with operational data. Consider 2D vector or raster data. In the recent past, when most of the map views were 2D, these would be overlaid on each other. Now, we need to combine them with 3D information. Depending on the data set, it makes sense to drape it over the terrain only (like a satellite image) or to drape it over 3D content (like the area of a city that will be affected by the shadow of a sizeable new construction). The LuciadRIA 2022.1 release makes it possible to drape 2D content over 3D meshes data. See the figures Figure 4, “Draping of an area of interest on a 3D city model.” and combination of building polygon data and a 3D building model.
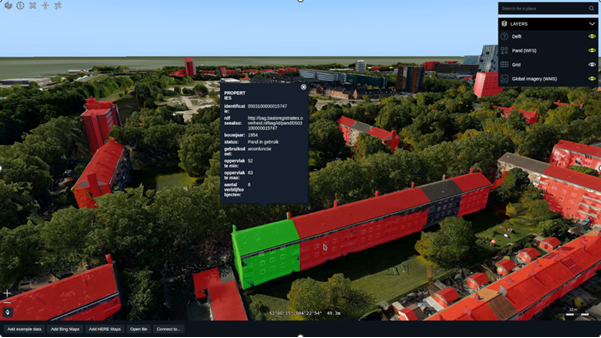
LuciadRIA not only visualizes 2D content but also allows interactive on-map editing of 2D features draped over 3D meshes. You can select the draped content or hover over it with the mouse. See Figure 5, “Combination of building polygon data and a 3D building model, enabling users to select and access building information.”.
LuciadRIA API users can configure 3D tiles layers as “drape targets”. All data will then be draped on top of the 3D tiles layer. The default is false. In that case, the data will only be draped on the terrain and stay below the 3D tiles data.
Sample code to get you started
We extended the “OGC 3D Tiles” sample with a walking tour in the center of Marseille draped on top of the Marseille 3D tiles mesh data. The sample code shows how to configure the Marseille 3D tiles layer as drape target and how to drape the walking tour on top of this layer.
Bandwidth-efficient 3D scenes thanks to instancing of 3D icons
3D data sets that originate from scans contain all data elements. If an aerial scan captures a city, it models all houses, and if it captures a forest, all trees are there. The complete data set is encoded in a tile pyramid, for example. But if the data source contains 2D positions that you need to visualize with 3D models, it makes less sense to explicitly add every 3D model and create a tile pyramid. It is more efficient to have one model per type of 3D icon. For example, if the 2D dataset contains locations of bus stops, and the 3D models are either a 3D model of a bus sign or a 3D model of a bus shelter, another approach is more efficient. In that case, you would opt for instancing: you combine the 2D data set (with bus stops) and the 3D icons (two different ones) at visualization time and position each model as many times as needed to reflect the elements in the 2D dataset. Hence, instancing is a memory-efficient and bandwidth-efficient solution.
The 2022.1 release of LuciadRIA adds support for instancing 3D icons in the glTF format or based on custom meshes.
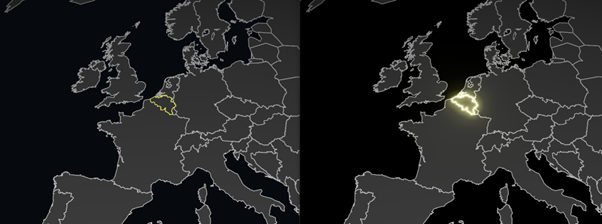
Attract your users’ attention with bloom effects
Bloom is a way to convey intense brightness to the viewer by adding a glow to the bright object. The light then bleeds around these bright objects. Bloom creates the illusion that objects on the map are intensely bright. This effect can add to the perceived realism of a scene. You can also, for example, use it to draw focus upon shapes. The latter is a benefit within a busy common operational picture.
LuciadRIA now offers a BloomEffect and a BloomStyle to add a global or feature-specific bloom effect to your LuciadRIA WebGL map.
Sample code to get you started
The following samples show how bloom can be used:
-
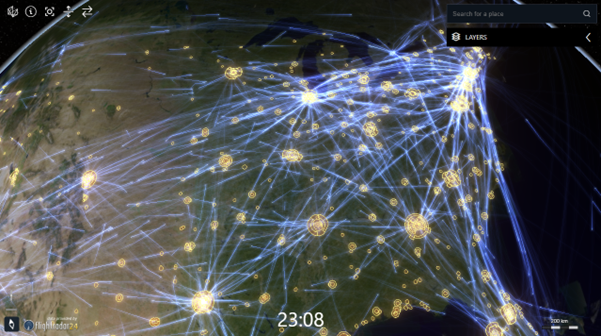
The “Trajectories” and “Vertical View” samples to highlight airspaces data.
-
The “Panorama” sample to highlight waypoints when you hover over them in the main map.
-
The “3D Icons” sample to highlight the billboard on the aircraft carrier.
The Configuring WebGL Map effects article discusses the use of the bloom API in more detail.
Extended OGC SE styling capabilities
OGC Symbology Encoding (SE), previously called Styled Layer Descriptor (SLD), is a standard for cross-platform and cross-vendor style definition. People widely use OGC SE to style data and to exchange styles between different components in an interoperable way. This 2022.1 release adds the following OGC SE styling capabilities to LuciadRIA:
-
To extend the expressive power of OGC SE’s label styling options, you can define a label box in a text symbolizer. Aligned with LuciadLightspeed and LuciadFusion, this feature relies on vendor options to add new capabilities to OGC SE.
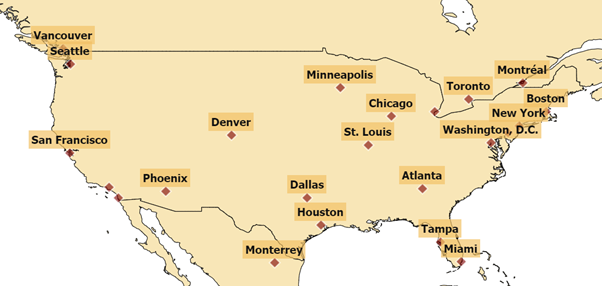 Figure 8. The Symbology Encoding sample adds a label box to the US cities data.
 -
You can use a perpendicular offset on a polygon or line symbolizer. When applied to a polygon, a positive or negative offset value draws the polygon respectively larger or smaller than its actual geometry. LuciadRIA interprets the offset using the unit of measure defined on the symbolizer, which is pixels by default. An example use case of this capability is the styling of class-based airspaces.
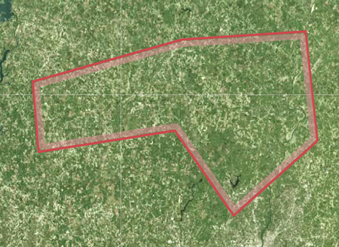 Figure 9. A class-based airspace styled according to ICAO’s Annex 4 charting guidelines, using polygon symbolizers with a perpendicular offset.
 -
You can combine a simple (plain or dashed) stroke with icons. The location of these icons can be further adjusted using a displacement or anchor point shift.
-
You can use a displacement on a polygon symbolizer to shift the polygon in the X and Y direction. LuciadRIA interprets the displacement value using the unit of measure defined on the symbolizer, which is pixels by default. An example use case is to add a shadow effect to polygons.
 Figure 10. A park area from the OGC SE Sample, combining several of the line and polygon styling improvements. A first polygon symbolizer uses a black fill with a displacement to apply a shadow effect. A second polygon symbolizer defines the park area’s fill and outer stroke, which is a combination of a dashed stroke and an icon with a shifted anchor point. A third polygon symbolizer with a negative perpendicular offset is used to draw the smaller green area on top.
 -
You can now define world-sized graphic fills on a polygon or line symbolizer. Instead of always assuming pixels, LuciadRIA now interprets the size of the graphic used for the fill using the unit of measure defined on the symbolizer.
-
Support has been added for the stroke parameters
lineJoinandlineCapin WebGL for simple (plain or dashed) strokes. These parameters define how lines should be joined (between line segments) and capped (at the ends of a line). The possible values forlineJoinaremitre,roundandbevel; the values forlineCaparebutt,roundandsquare.Railroads styled with 3 different line join settings Figure 11. Mitre line join.
 Figure 12. Bevel line join.
 Figure 13. Round line join.
 -
The custom icon provider you can plug in to map external graphic references on icon images now also supports SVG.
Sample code to get you started
We updated the styles used by the existing LuciadRIA “Symbology Encoding” sample to showcase a few of the new possibilities. Because of its interactive style editing panel that allows you to modify styles and see the result in real time, it is also a great starting point for exploring the OGC SE styling capabilities.
For further guidance, the new how-to article SLD styling – Supported versions and capabilities gives a fine-grained overview of the supported styling capabilities.
In addition, a new how-to article How to draw a box around labels offers more detail on how you can add a label box.
Faster, more flexible and instructive military symbology
LuciadRIA has supported military symbology from its early versions. You can seamlessly integrate tactical graphics and icons for all MIL-STD 2525 and APP-6 standards with a wide range of styling options. The 2022.1 release introduces several new benefits when using military symbology.
Easy look-up of symbols and how they are created
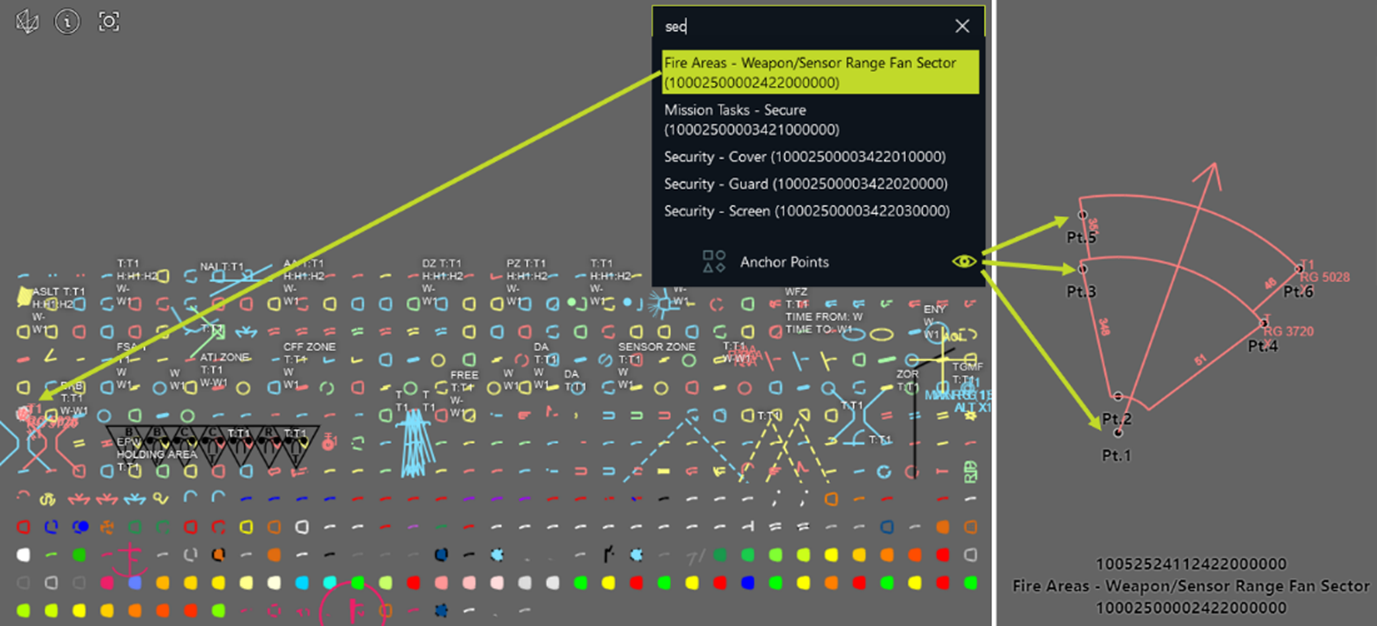
The Military Symbols Overview sample provides an overview of all supported military symbols for the MS2525 and APP-6 standards. The 2022.1 release further improves its user experience and functionality: the sample now serves as an interactive version of the supported standards, enabling you to look up symbols and the required anchor points to create them. The top right of the sample offers a search bar for you to enter a symbol name or code. The map fits on the resulting symbol and visualizes its anchor points. When edit a symbol on the map afterwards, for example by adding points to a line or area, you can easily see where they appeared within the set of anchor points.
Faster loading of tactical graphics on a WebGL map
Loading many different tactical graphics simultaneously on a WebGL map can be a burden due to the time-consuming process of WebGL shader compilation. To improve the user experience for such use cases, you can now initially render symbols using a fast “skeleton” style. This style represents symbols in a simplified way, with simple lines, and without decorations. Afterward, you can repaint them one by one using the accurate “body” style, which does include complex strokes and decorations. This approach prevents delays due to shader compilation, ensuring an interactive user experience. A new article, Boosting tactical graphics performance on a WebGL map, discusses this in more detail.
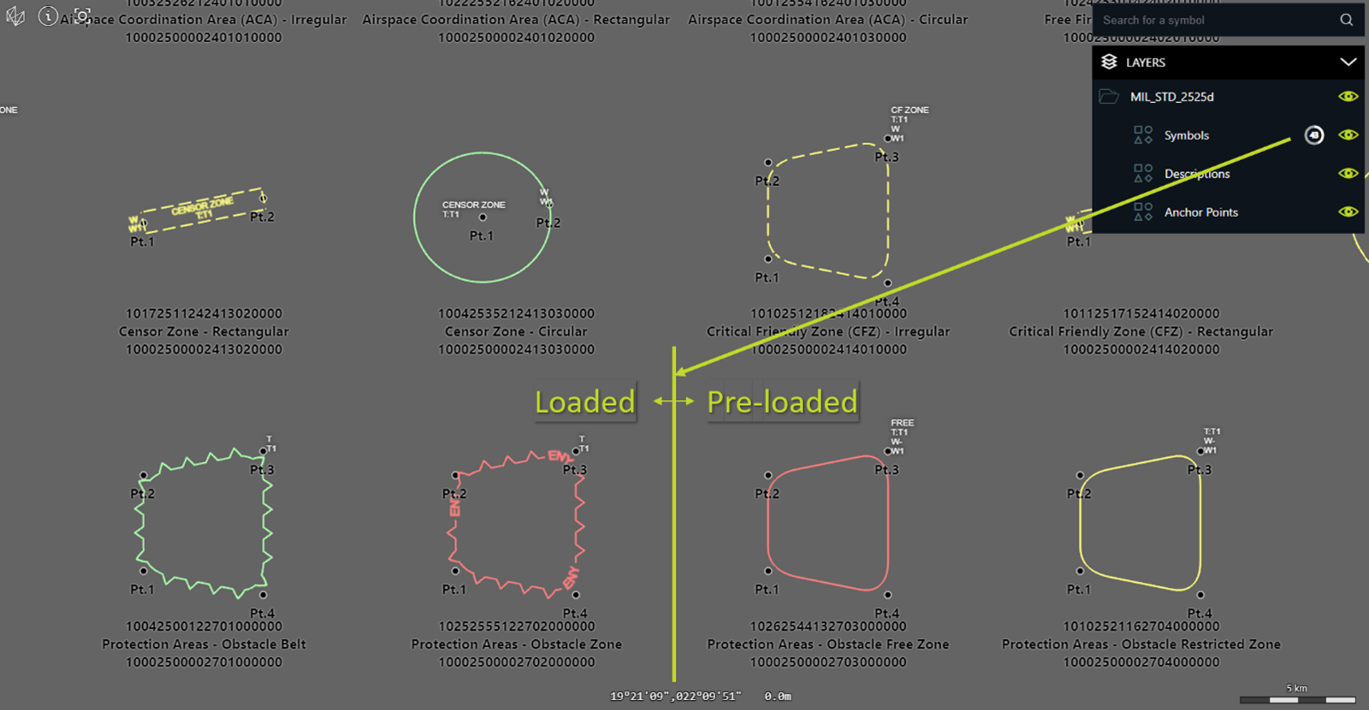
The “Military Symbols Overview” sample applies this approach to show the tactical graphics for each supported standard. The symbols are pre-loaded using the skeleton style and afterwards repainted one by one using the body style. The layer control panel tracks the loading progressof the fully styled tactical graphics.
Additional flexibility to style military symbols
The 2022.1 release introduces new styling options to customize the appearance of military symbols on a map:
-
Change the style of military symbols based on the paint state: you can customize the style of each military symbol based on whether it renders in regular, selected, or hovered mode. The “Military Symbols Overview” sample uses this capability to style symbols with a halo when you hover over them.
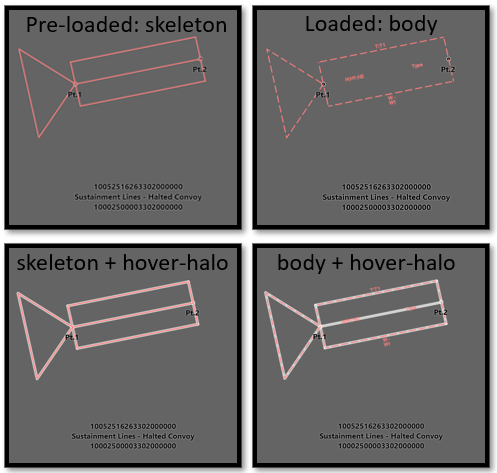 Figure 16. The Military Symbols Overview sample applies a white halo when you hover over a symbol.
 -
Enable or disable label decluttering for military symbols: you can define whether the labels of military symbols on a map can be decluttered, or whether they need to be always visible, regardless of any overlap.
-
Customize the length of military symbol speed indicators: you can supply a length ratio to define how a speed value needs to convert to a speed indicator length in pixels.