You must visualize RasterTileSetModel instances with view/tileset/RasterTileSetLayer.
You typically configure raster layers with the BASE LayerType, because they often show background data:
RasterTileSetLayer with the BASE layer type
const rasterLayer = new RasterTileSetLayer(model, {
  layerType: LayerType.BASE,
  label: "Earth imagery (Fusion)"
});

map.layerTree.addChild(rasterLayer, "bottom");
Raster services, such as Web Map Services (WMS), also support transparent raster data. If you use transparent raster data,
you can display two or more raster layers on top of each other. You can display raster data with roads or waterways on top
of a raster with satellite imagery, for example.
You must configure such overlay raster layers with the STATIC or DYNAMIC
LayerType. Those are the layer types that you can place on top of BASE layers.
|
When LuciadRIA visualizes raster data on a |
Apply custom styling to a raster layer visualized on a LuciadRIA map
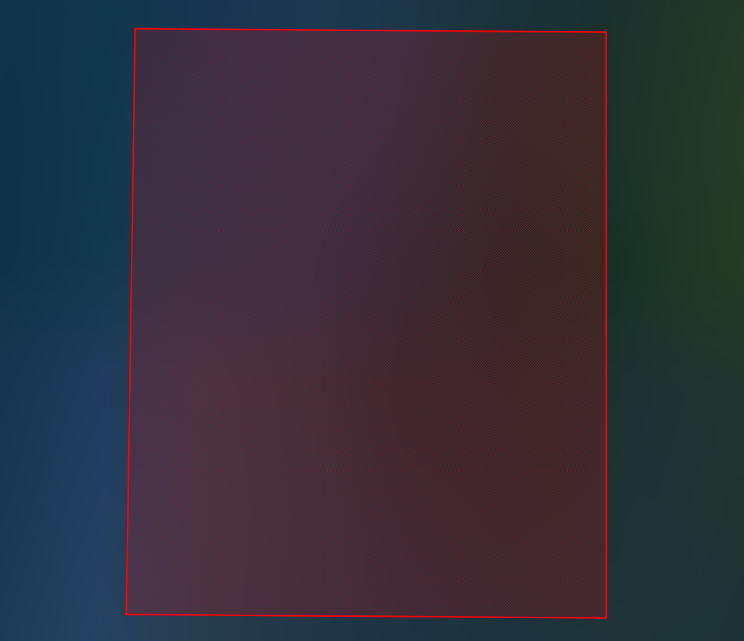
Show a hatched rectangle instead of the actual raster data
Most raster data is suitable for display at specific scales only. For example, it makes no sense to show detailed raster data of a certain area when users have zoomed out of a map. They won’t be able to distinguish the details on the map at that point.
If the application doesn’t load that raster data when users have zoomed out, application performance increases, and it no longer needs to consume large amounts of memory. Instead, the LuciadRIA map shows just the geographical bounds of the raster data set when users zoom out.
By default, those bounds get a style that consists of a red hatch pattern.
This example mimics that styling by setting the lineStyle and fillStyle properties of RasterStyle. Those properties respectively define the outline and the fill of the bounds.
const redHatchedRectangleLineStyle = {
  color: "rgb(255,0,0)",
  width: 2.0
}

const redHatchedRectangleFillStyle = {
  image: new HatchedImageBuilder()
      .patterns([HatchedImageBuilder.Pattern.SLASH])
      .backgroundColor("rgba(255,0,0,191)")
      .lineWidth(1.5)
      .lineColor("rgba(255,0,0)")
      .patternSize(5, 5)
      .build()
}

rasterLayer.rasterStyle.lineStyle = redHatchedRectangleLineStyle;
rasterLayer.rasterStyle.fillStyle = redHatchedRectangleFillStyle;
This is the result on the map:
If you don’t want the map to show the geographical bounds of the raster data set when users zoom out,
you can set the lineStyle and fillStyle properties to an empty object literal {}.
|
See Why does my imagery layer show a red (hatched) rectangle? for more information about the red hatching pattern. |
Change opacity, brightness, contrast, or modulation color
RasterStyle also has properties that affect the visualization of the raster image itself. These allow you to change
the opacity, brightness and contrast of the raster imagery. You can also apply a modulation color.
rasterLayer.rasterStyle = {
  brightness: 1.2,
  alpha: 0.8
}