What happens?
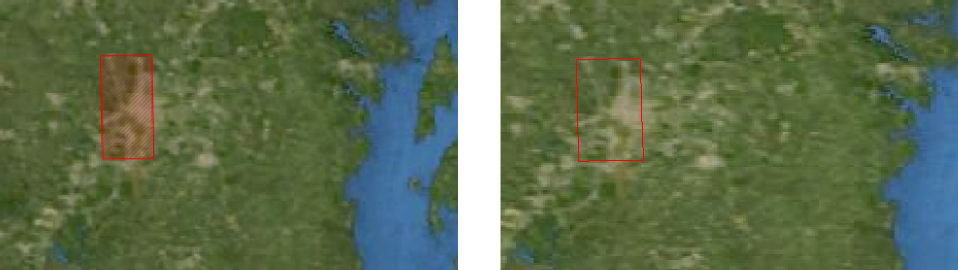
Your imagery layer displays a red hatched rectangle instead of any actual imagery data. You see this rectangular box when you have zoomed out to a fair distance from the data.
Why does this happen?
The red rectangle is a placeholder for the actual data, and indicates the position of the data on the map. The placeholder protects you from loading too much imagery data.
Suppose that you create a RasterTileSetModel based on an imagery dataset that covers a small city. This dataset consists of a tile matrix set that has a 8x8 tile matrix, 512x512 pixels each, at the coarsest level. You load the dataset on your map while you’re zoomed out far enough to see an entire continent. At that point, the area covered by the image corresponds to only a small part of your screen, say 20x20 pixels. To render those 20x20 pixels, the rendering engine would have to load the whole tile matrix - ~50 MB. That would be fine if it were the only thing it had to do, but you probably have lots of other datasets to handle as well. From that zooming distance, you wouldn’t be able to see any meaningful detail of the imagery anyway.
That’s why the default LuciadRIA settings prevent the data from loading. LuciadRIA shows a placeholder rectangle instead of the actual data.
How can you prevent this?
To make the rectangle go away and see your imagery, you have a couple of options:
Simply zoom in
Zoom in to make your imagery data visible. If you zoom in on the map, the rectangle eventually disappears and the actual imagery data is loaded. The imagery appears when you reach a map scale that’s a better match for the dataset: the number of pixels in the tile matrix corresponds better with the number of pixels effectively drawn on the screen.
Use multi-leveled imagery data with an optimal structure
Instead of using a dataset that has a large tile matrix at its coarsest level, choose datasets with a tiling scheme that’s optimized for higher map scales too. In other words, use a tile matrix set that has few low-resolution tiles at the coarsest level. For example, suppose that the city imagery dataset mentioned earlier consists of a tile matrix set with a single 512x512 tile at the coarsest level. In this case, LuciadRIA doesn’t need a placeholder for the actual data, and doesn’t show the red rectangle at any map scale.
Use LuciadFusion tools
If a WMS or WMTS service created in LuciadFusion Studio is serving your imagery, you can make use of the options offered by LuciadFusion to prevent the placeholder behavior. See How can I prevent this for a WM(T)S service created with LuciadFusion Studio for more information.