To allow your users be as efficient as possible, it is essential that you come up with a good way of presenting the data in your application: you need to consider how you can visualize the data meaningfully, and users must also be able to edit the data effectively. While you are tuning the visualization and editing of your data, you may also need to take usability studies as well as detailed customer requirements into account. Both can specify stringent requirements concerning data styling and editing.
To help you match the requirements to the styling and editing options offered by LuciadLightspeed, this article offers as a visual guide. It describes available options in LuciadLightspeed, illustrates them with screenshots taken from LuciadLightspeed applications, and provides code pointers.
Icons
| Screenshot | Description | Code Pointers |
|---|---|---|
|
|
Image icons You can use icons to style a point with an image. Because those images can display detailed information about the point, they are very informative to the user. In LuciadLightspeed, image icons are very versatile: there are many ways to create and use them. |
|
|
|
Icons using AWT graphics
The image on the left illustrates that with an APP6-C military symbol. Internally, we use AWT graphics to draw those symbols. |
|
|
|
Icon decorators LuciadLightspeed has many utility decorators available for This image shows that you can combine multiple icons into one without hassle. It shows vehicle icons inserted into circular icons that represent the status of the vehicle. You can also rotate existing icons and put a halo around them. |
|
|
|
World-oriented icons Here’s another military symbol. In this case, it has an arrow indicating the direction of the military unit. The arrow is an icon that is world-oriented: it is automatically rotated on the screen based on the world direction of the object, specified as an azimuth angle. In 3D, world-oriented icons are often draped. |
|
|
|
World-oriented icons This icon is an S-52 navigational chart symbol for a light that emits a different color in different directions. It is drawn using AWT graphics, and is world-oriented. |
ILcdIcon
|
|
|
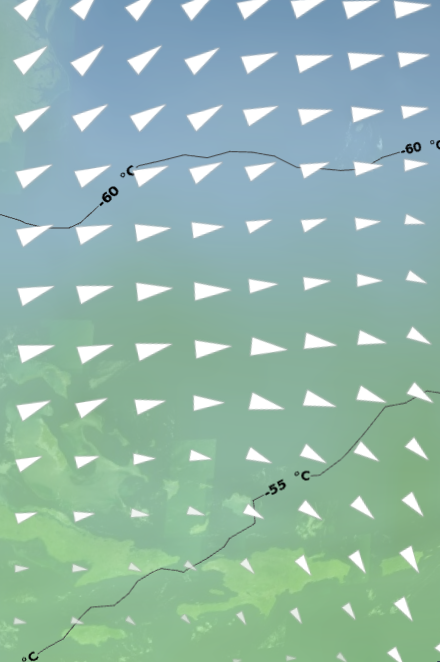
Icons for raster data Here, icons are used to display raster data. in this case, they display wind strength and wind direction values stored as raster data. LuciadLightspeed can:
|
|
|
|
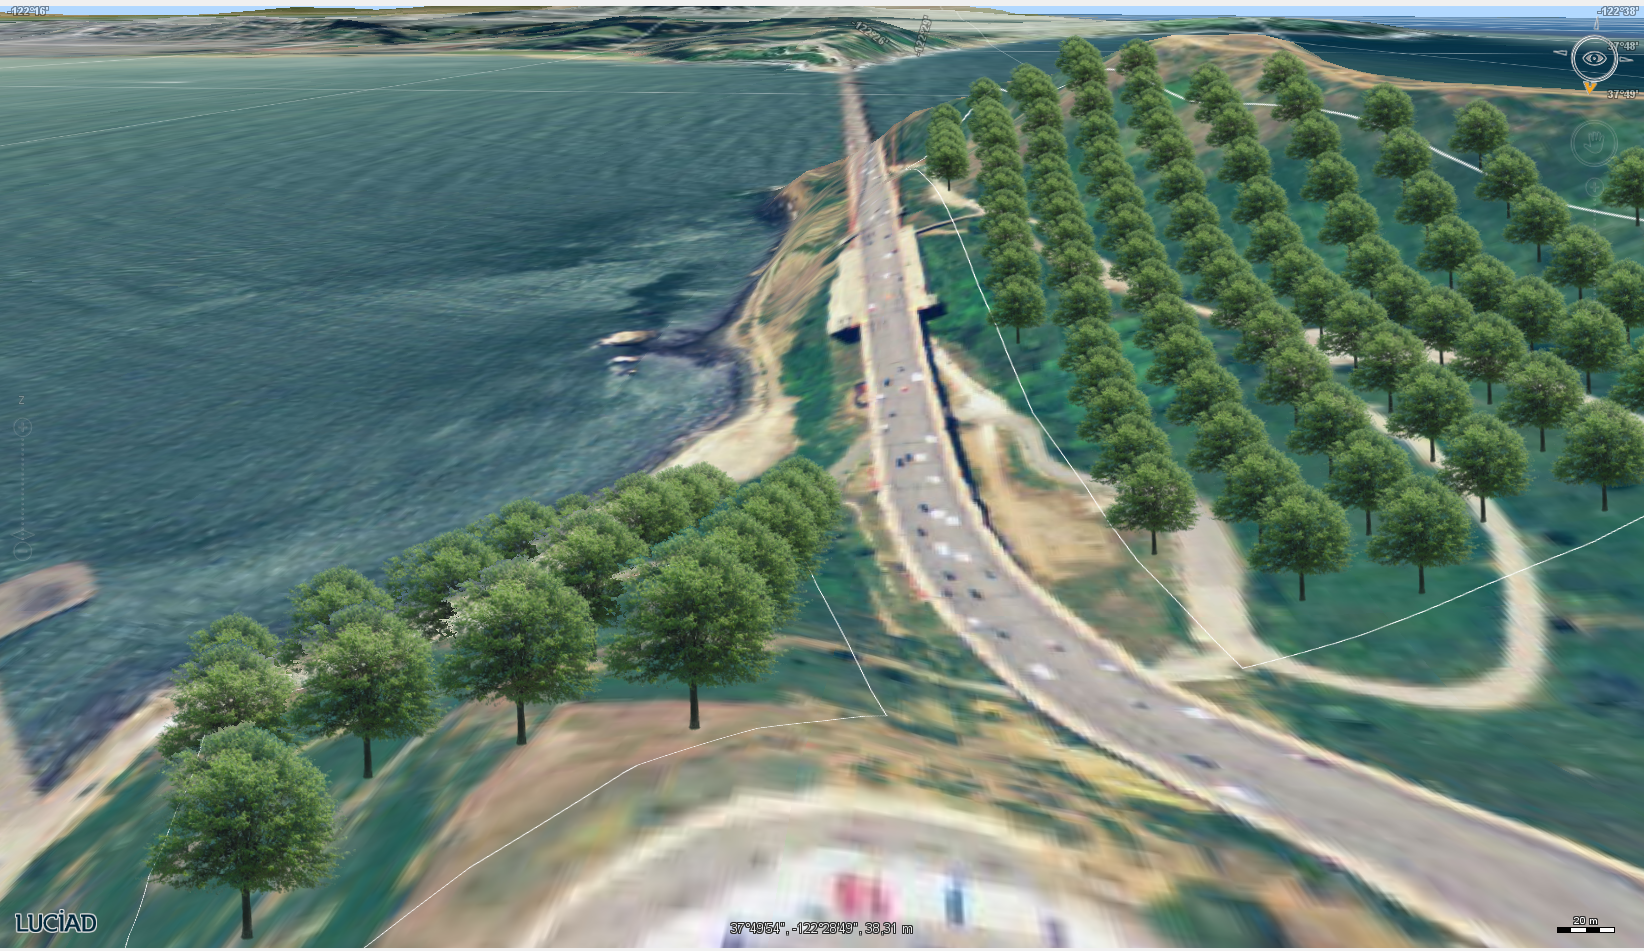
World-sized icons This image show a bunch of icons used to fill an area, tree groups in this case. The icons themselves are world-sized: instead of a fixed size on the screen (in pixels), they have a fixed size in world (in meters), so they grow larger and smaller depending on the zoom level. This is often useful to prevent clutter in areas far away from the viewer. |
|
|
|
Animated icons Although not visible in this screenshot, the explosion is animated. To achieve such an animation, you can:
|
|
|
|
Icon placement in 3D LuciadLightspeed offers several options for the placement of icons in 3D
|
Draped: Displaced:
Anchored:
Above terrain:
|
|
When you implement
In addition: if you have icons that are larger than 64x64 pixels, use |
3D icons
| Screenshot | Description | Code Pointers |
|---|---|---|
|
|
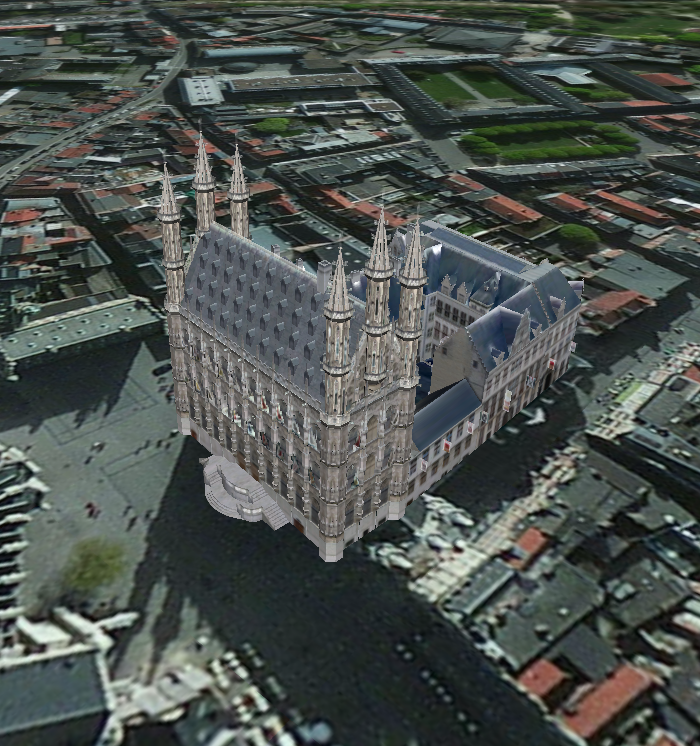
Static 3D icon Here we show a building at a certain location. The building here is loaded from a KML/Collada file. |
|
|
|
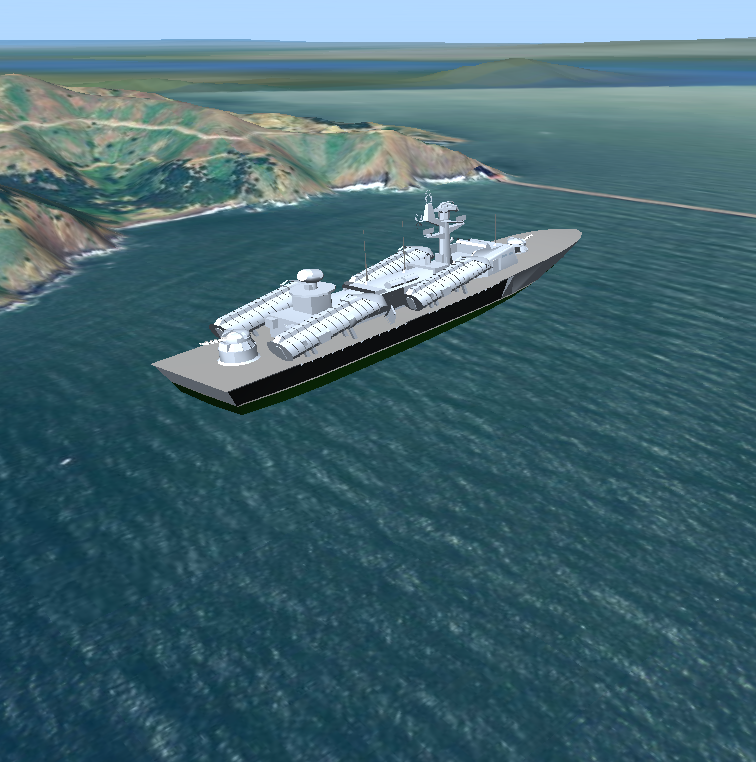
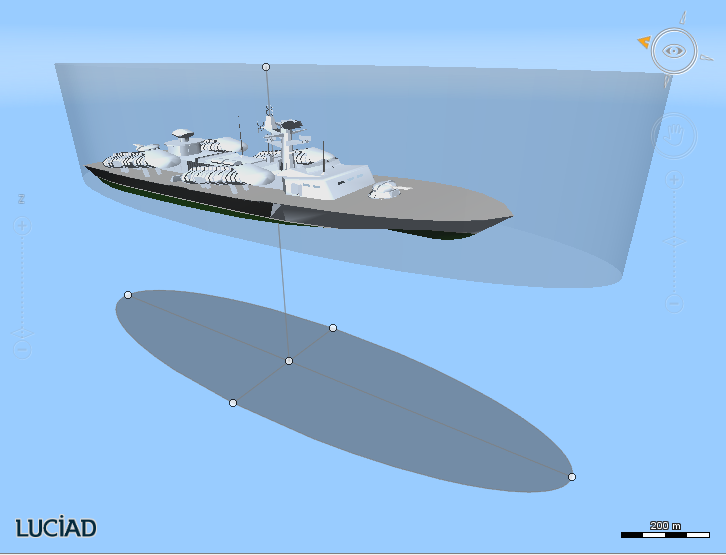
Dynamic 3D icons Similarly, a 3D mesh of a ship is used to style a point object in this ship. The ship is loaded from an OBJ file. |
|
|
|
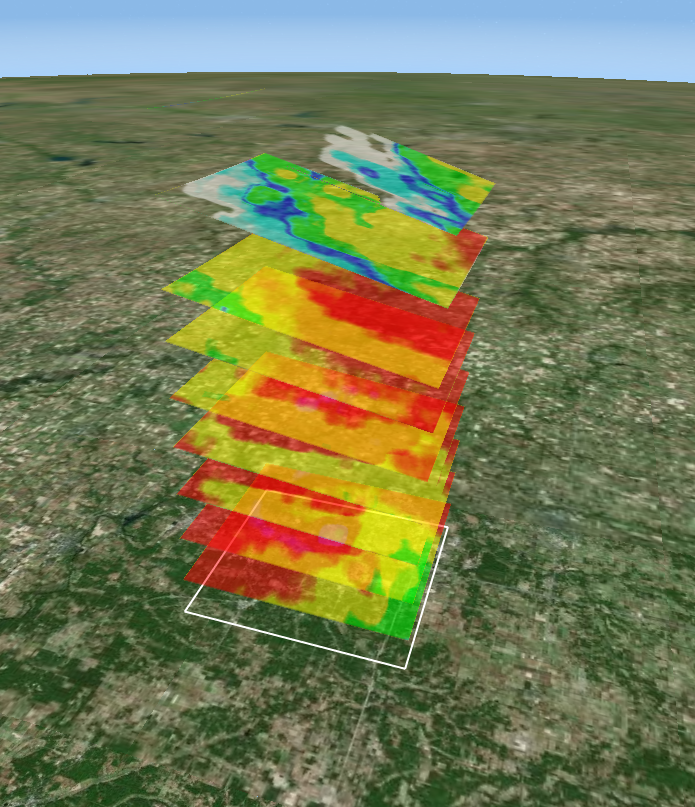
Custom 3D mesh Here is a mesh that has polygons at different altitudes. Each polygon has a texture representing wind speeds. You can create the mesh on the client. |
|
|
|
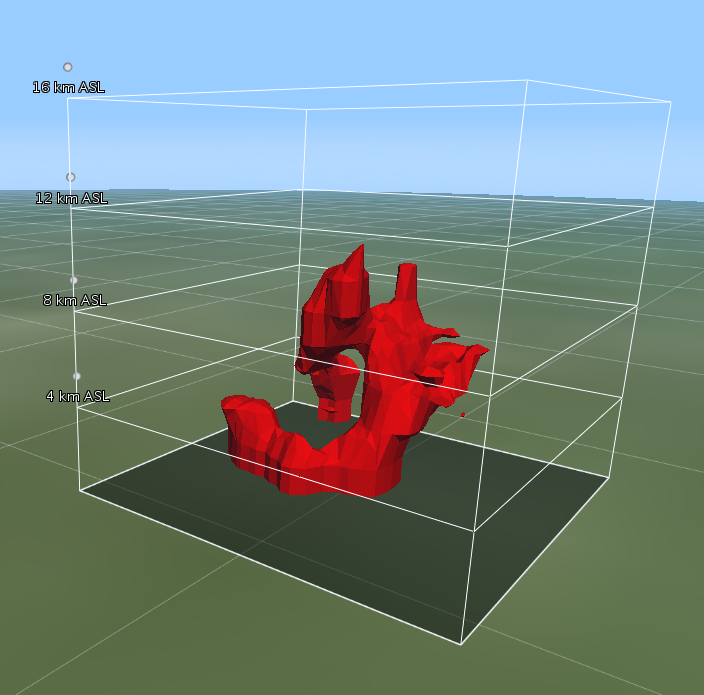
Custom 3D mesh This is a 3D shape visualizing the storm-force wind speeds of the image above. You can generate the shape on the client. |
Lines
| Screenshot | Description | Code Pointers |
|---|---|---|
|
|
World-sized lines The line in this image is world-sized: it has a width in meters, not pixels. It’s also outlined by submitting two line styles for the object, each with a different z-order. |
|
|
|
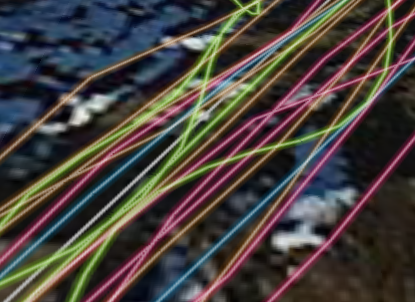
Outlines Here, multiple line styles are used to get a glow effect on the line. |
Complex strokes
LuciadLightspeed offers complex stroking functionality. Complex strokes are very powerful. The images below are all examples of complex strokes used to display information in different domains, and in 2D as well as in 3D.
| Screenshot | Description | Code Pointers |
|---|---|---|
|
|
Complex stroking for military tactical graphics This image shows APP6-C tactical graphics, drawn using LuciadLightspeed complex stroking functionality.. |
|
|
|
Complex stroking for maritime navigation charts Here, complex strokes are used to style maritime data with S-52 styling. |
|
|
|
Complex stroking in 3D This image shows that complex stroking also works in 3D. |
|
|
|
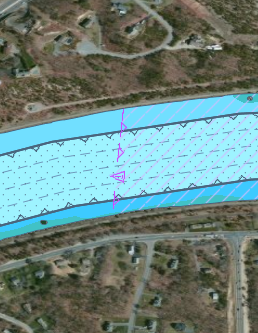
Complex stroking for airspace borders Here, complex strokes are used to draw the inner border of an airspace, with a marker included. |
|
|
|
Complex stroking for aeronautical charts This image shows a complex stroke in which the line ends a bit before its end point. Note: the arrow decoration is a label. |
Areas
| Screenshot | Description | Code Pointers |
|---|---|---|
|
|
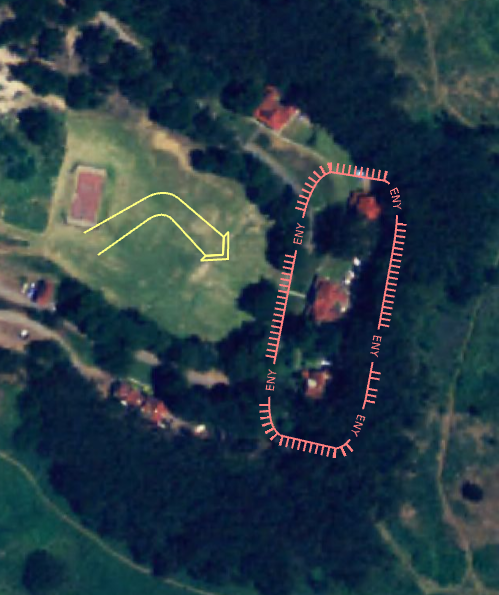
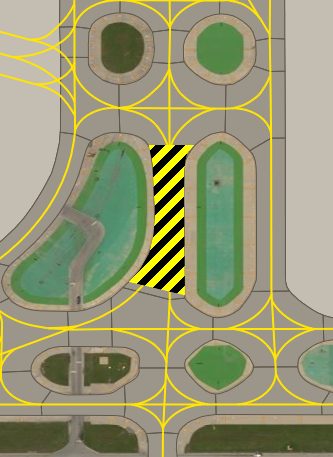
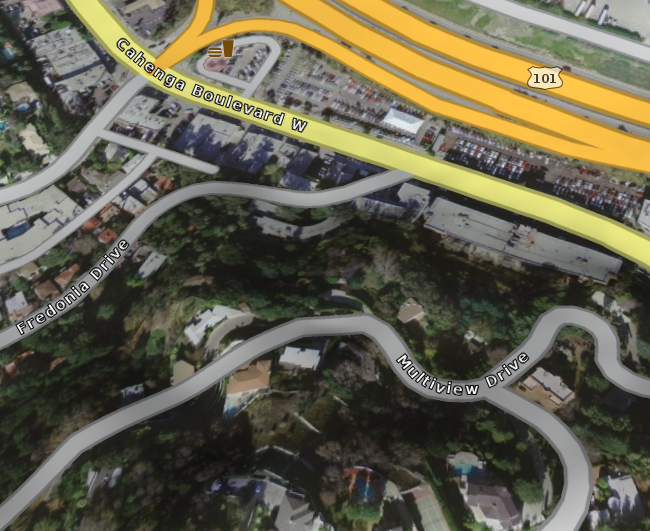
Area fills using icon patterns In this image, an area is closed off for work, and marked with a yellow/black pattern. |
|
|
|
Overlapping areas Here are two overlapping areas. You can trade off performance for visual quality:
|
|
Text
| Screenshot | Description | Code Pointers |
|---|---|---|
|
|
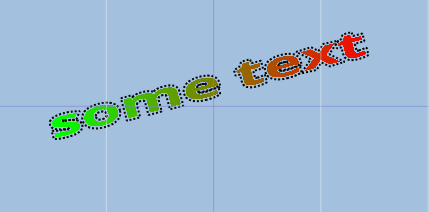
Area fills using text ILcdText covers a geographic area. You can style text with regular fill and line styles! |
Density plots
To learn about the creation of density plots in LuciadLightspeed, see How to visualize density plots or heat maps.
| Screenshot | Description | Code Pointers |
|---|---|---|
|
|
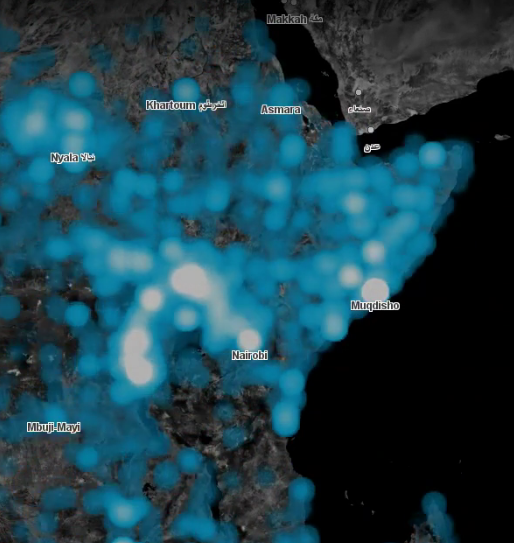
Standard heat map The density plots, or heat maps, we all know and love. You can create density maps with any style: an icon style, a line style, a fill style, and so on. This means that you can use any shape: points, lines, polygons, circles, and so on. |
|
|
|
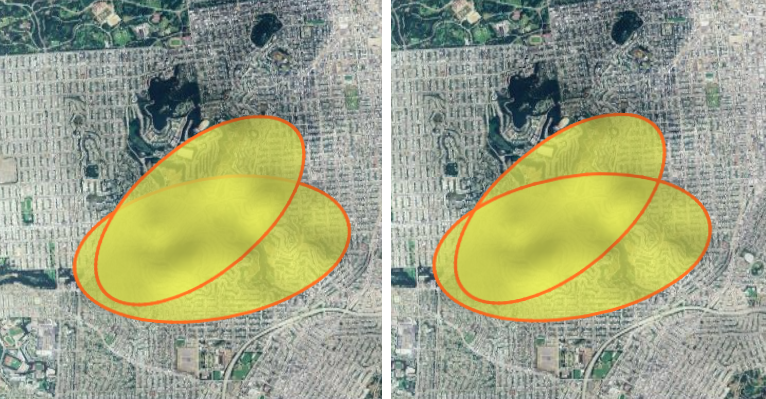
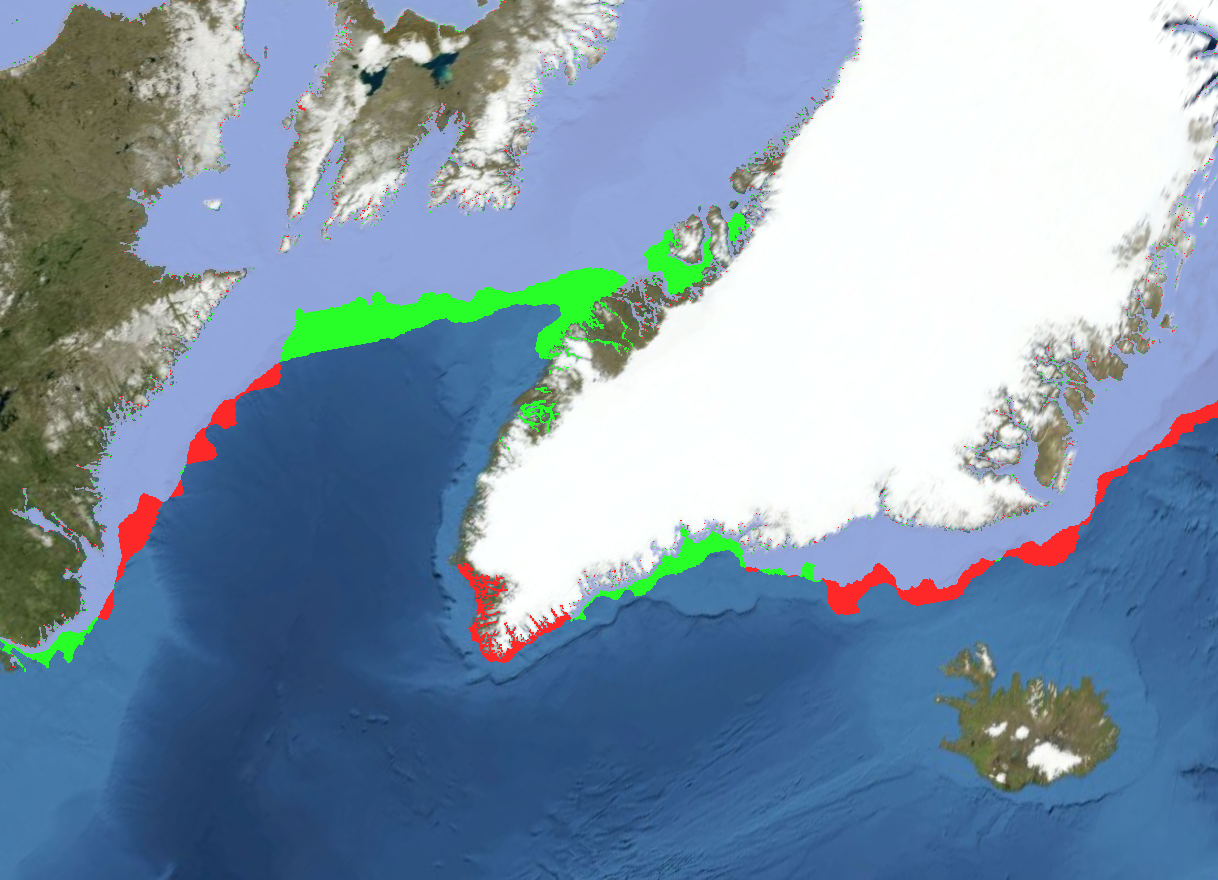
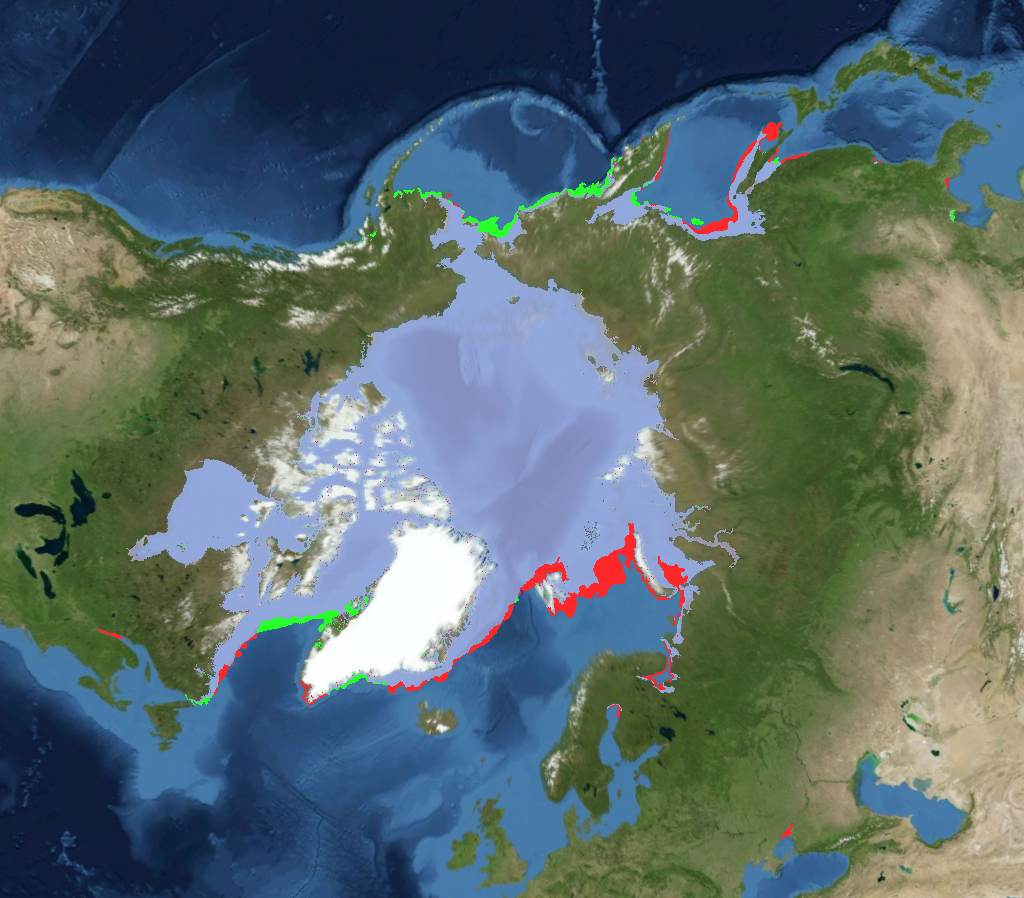
Classification and change detection using density plots with a discrete color map Here, we used a piecewise constant color map, as opposed to a gradient color map, to classify pixels. We have two overlapping polygons, representing ice coverage in January 2015 and 2016.
|
|
|
|
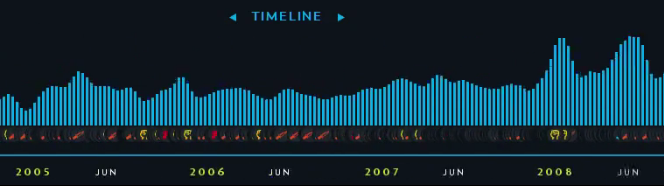
Histograms using density painting This example is very advanced, but has density painting at its core. First, density painting is used to render the timeline as icons to an off-screen view. That view is read out, and in a second pass, the histogram is rendered. |
Labels
| Screenshot | Description | Code Pointers |
|---|---|---|
|
|
Standard labels LuciadLightspeed includes out-of-the box support for labels:
To learn the basics of LuciadLightspeed labeling, see Labeling domain objects in a Lightspeed view. |
|
|
|
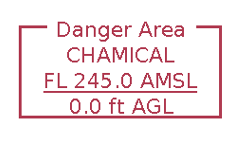
Labels using AWT graphics You can use AWT graphics to fully customize your label, just like you can with icons. This image shows an airspace label. |
|
|
|
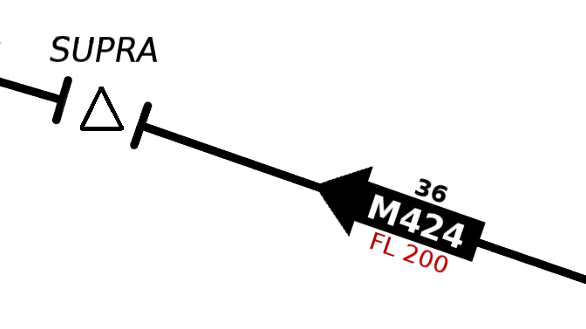
Labels using AWT graphics Here, the arrow with 'M424, 36, FL 200' is a label, positioned along the line. It is drawn using AWT graphics. |
|
|
|
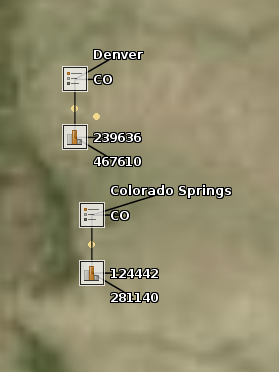
Label placement for points This image shows 2 domain objects that represent cities. Each city object has 6 labels. The outermost labels are positioned relatively to the square labels closer to the domain objects. You can place labels:
You can fully customize the placement if you need to. |
|
|
|
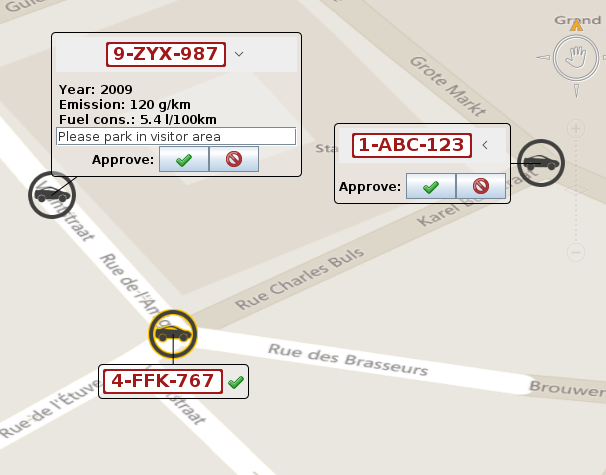
Interactive labels using Swing Here, objects are labeled using a Swing component. The Swing component is still active, and can be used instantly without selecting the object. |
|
|
Label positioning You can fully customize label positioning. |
||
|
|
Label de-cluttering You can fully customize the de-confliction, or de-cluttering, of your labels. |
|
Alternate geometry
Using ALspStyleCollector.geometry, you can paint geometry other than the default geometry associated with your domain object. Those alternate geometries defined
for a domain object are also known as style targets in LuciadLightspeed.
They are a very powerful way of customizing the painting of your objects.
| Screenshot | Description | Code Pointers |
|---|---|---|
|
|
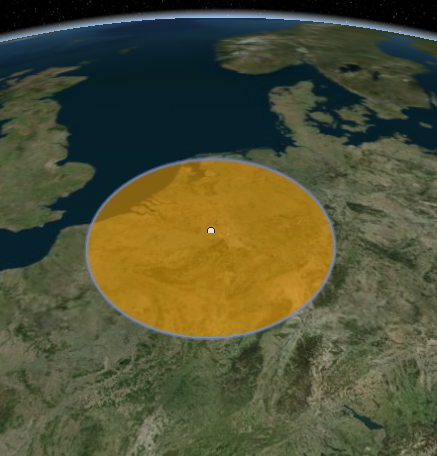
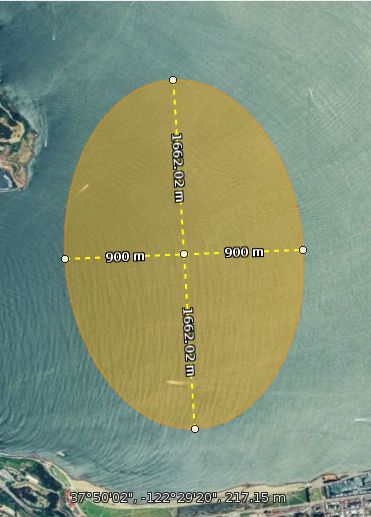
Use a different geometry than the one associated with the domain object Here, the image paints a circle to visualize a domain object that has a point shape and a radius property. See also editing: when a user edits the circle’s radius, the new radius value is saved in the domain object property. |
|
|
|
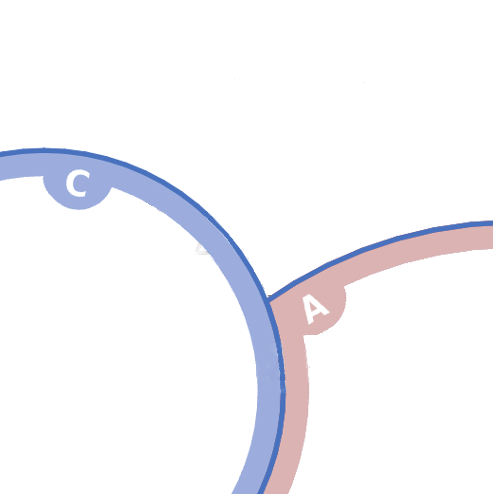
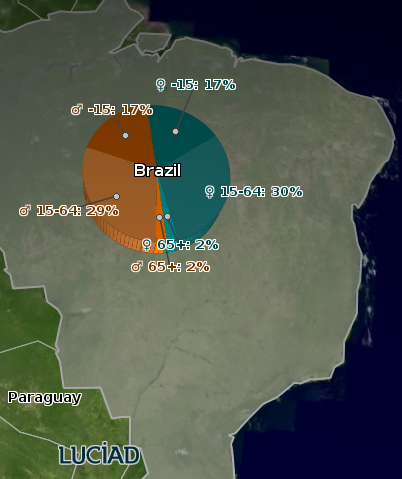
Use an entirely different geometry The pie chart in this image is a collection of arc bands with labels, although the domain object is a polygon. The alternate geometry and the labels are calculated and submitted in a regular styler. |
|
|
|
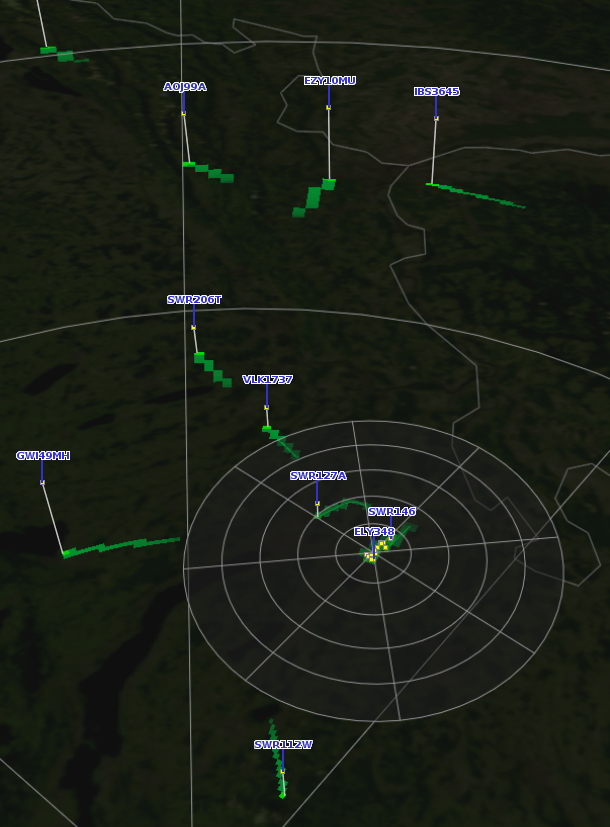
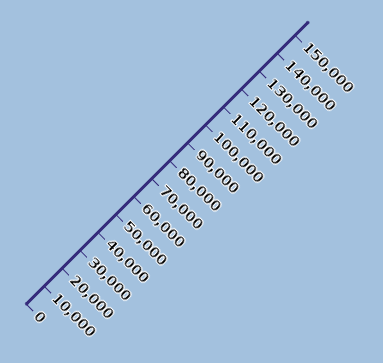
Select a sub-shape using In this image, various points along a line are marked with a tick icon and a label. The domain object is a line, but the styler submits individual points. |
|
|
|
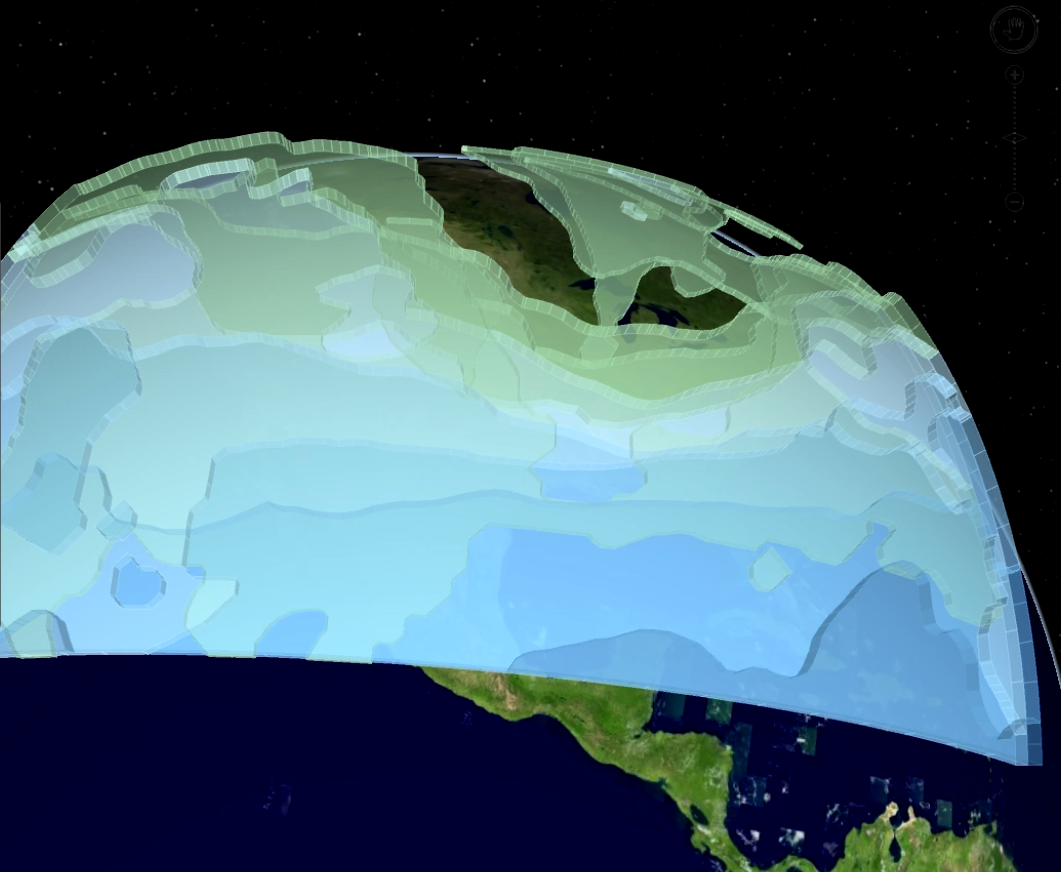
Using calculations to visualize extruded shapes as an alternate geometry The extruded shapes are based on the contour calculation of weather data. |
|
|
|
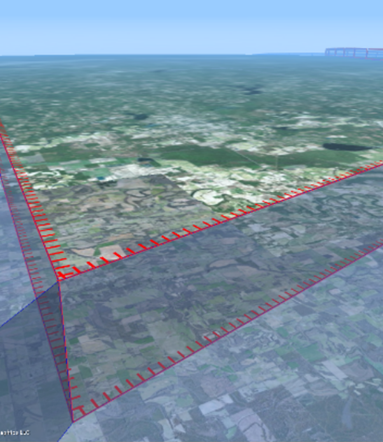
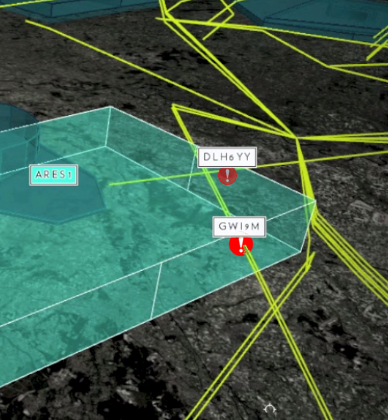
Calculating and visualizing intersection points The two red icons indicate where the yellow trajectory line crosses the airspace, represented by the green-blue extruded shape. The intersection points are calculated and submitted in the styler. |
|
|
Custom editing
For the basics of editing objects in LuciadLightspeed, see Creating and editing domain objects in a Lightspeed view.
| Screenshot | Description | Code Pointers |
|---|---|---|
|
|
A simple point object with a radius property is edited as a circle. The circle’s radius is pushed back on the property while editing. |
|
|
|
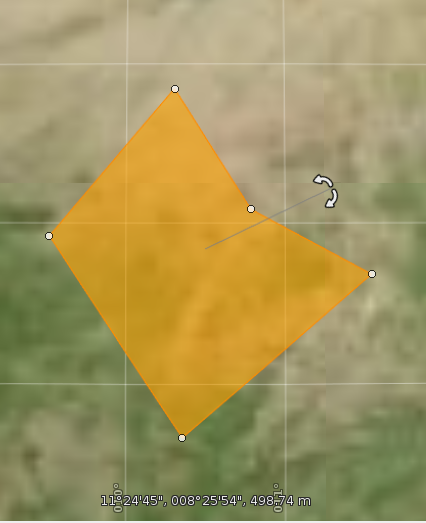
Extending standard editors The existing polygon editor is extended with a shape rotation handle. You can also remove handles to get additional constraints. |
|
|
|
Re-styling the standard editors You can add styling for the |
|
|
|
Re-using a standard editor A 3D object is edited using the existing extruded ellipse editor. In the |
Custom geometry
Custom geometry takes the customization yet another step further, beyond the use of style targets and alternate geometry.
With custom geometry, you model your own ILcdShape object, and write code to convert it into a 3D mesh.
You can add textures to that mesh.
| Screenshot | Description | Code Pointers |
|---|---|---|
|
|
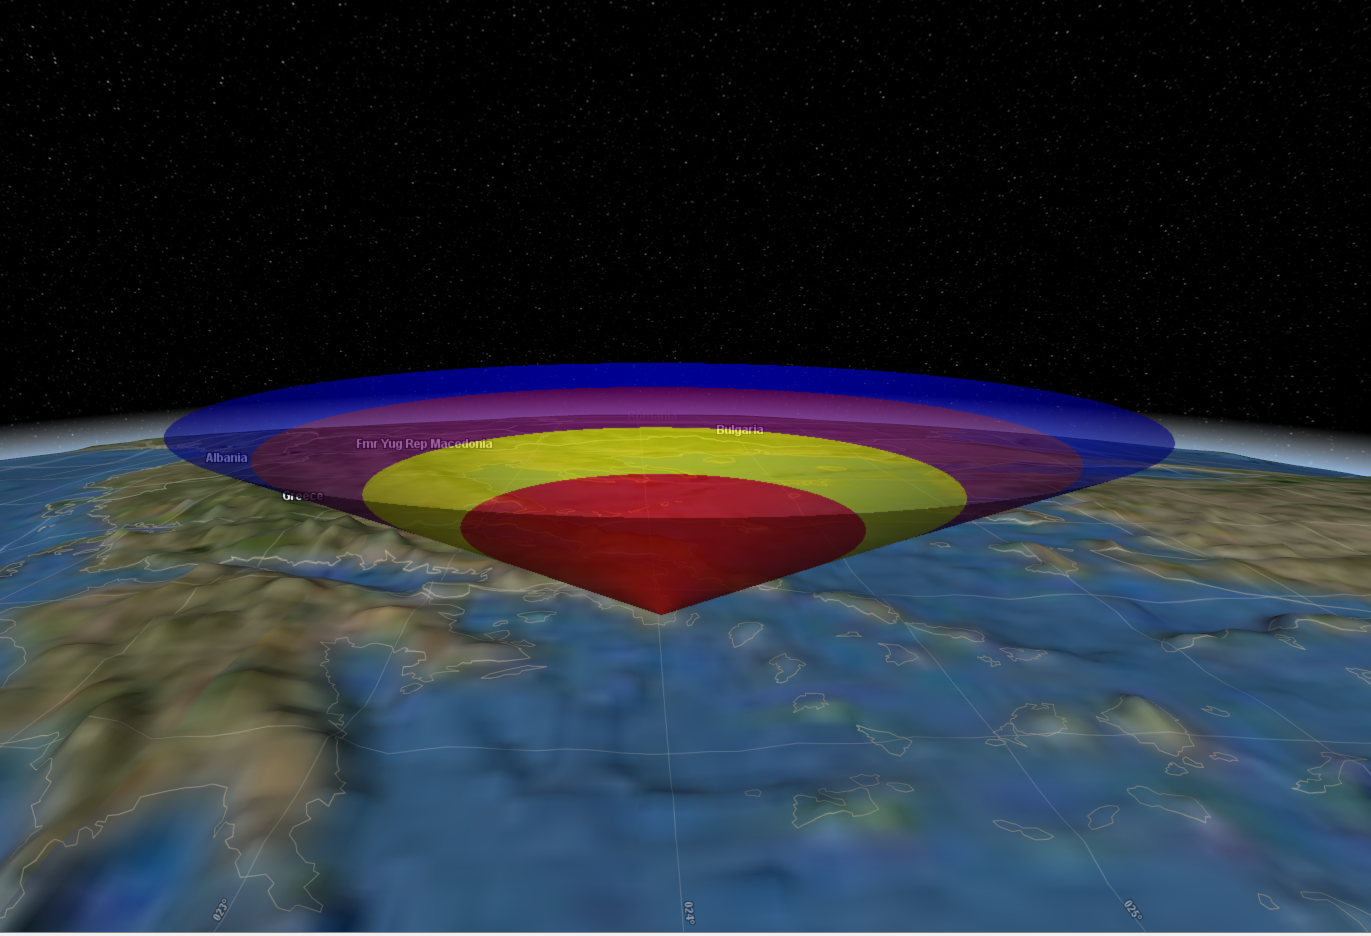
This image displays a custom cone shape. |
Custom OpenGL painting
If you can’t find the right tool for your styling and editing needs in the options presented above, you can still resort to custom OpenGL painting.
LuciadLightspeed still helps you out with:
-
Draping
-
Transparency
-
3D
-
Camera
| Screenshot | Description | Code Pointers |
|---|---|---|
|
|
Before we had radar support built-in in LuciadLightspeed, a customer used OpenGL to develop a stand-alone painter that displays radars efficiently. |