Users of your application want to see and change the map scale in a familiar way. There should be a direct relationship between a unit of measurement on the map and the actual distance. Most users are familiar with the scale indications displayed on paper maps. Paper maps usually display the scale in the margin of the map, and use fractional scales and bar scales. Those are just about the simplest way to convey map scaling information.
This article shows you how LuciadCPillar handles map scales. It starts by explaining more about the nature of map scales. Next, it describes how to use map scales in LuciadCPillar, and how to interpret them.
Types of map scales
What are fractional map scales?
Fractional map scales relate a real distance on a map to a real distance on the earth, and represent this relationship as a fraction. For instance, a map scale of 1:20,000 tells us that 1 centimeter on the map represents 20,000 centimeter (200 m) in the real world.
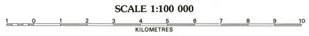
What are bar scales?
Bar scales are even easier to figure out than fractional scales. They visually represent the relationship between a distance on a map and a real distance on the earth. Using a bar scale, your users can understand the scale of a map at a glance. The length of a bar unit represents the earth distance displayed above the bar.
Note that LuciadCPillar doesn’t currently support bar scales out-of-the-box.
How can you use map scales in LuciadCPillar?
Visualize map scales accurately with the dots per inch (DPI) setting
To display map scales accurately, you must make LuciadCPillar aware of the number of dots per inch of the current display.
In general, the operating system makes this information available, but it can be inaccurate. Sometimes the operating system doesn’t advertise the DPI correctly. In some cases, it’s even impossible for the operating system to know the DPI. For example, if you’re using a projector, the DPI depends on the size of the projected image, or the distance from the projector to the screen. In such cases, it may be necessary to measure the DPI manually.
Once you have determined the DPI value, you must feed it into LuciadCPillar. For more information, see the article on HiDPI.
|
Don’t confuse the DPI setting, used to interpret map scales accurately, with the display scale, often used with high DPI displays. Displays with a high physical DPI often use a display scale provided by the operating system. That display scale forces the UI elements to render physically larger and with a greater number of pixels. The display scale is independent of the DPI value. That’s why it’s important to always give LuciadCPillar both the DPI value of your display (or an approximation), and the display scale, as independent values. |
Use map scales to control the visualization of features
In LuciadCPillar, you can use map scales to specify when the map displays features. To prevent clutter on the map, you can hide some features if the scale is below a certain point. Likewise, you can change the feature style so that LuciadCPillar shows more feature information when map users zoom in enough.
These are your API entry points for these capabilities:
-
FeatureQueryConfigurationFeatureQueryConfigurationFeatureQueryConfiguration: define which features to load into memory, depending on the current scale level. See Visualizing feature data for more information. -
IFeaturePainterdetail levelsIFeaturePainterdetail levelsIFeaturePainterdetail levels: change the appearance of a feature on the map, depending on the current scale level Visualizing feature data for more information.
Interpreting map scale
On most maps, a distance of 1 cm measured at two distinct spots on the map can cover quite a different distance in the real world. To represent the Earth on a 2D map, the Earth’s surface is projected on a plane. Such a projection almost inevitably leads to distortions. The commonly used Mercator projection, for example, distorts sizes and distances. The distance represented by a scale unit converges to zero as you move towards the poles. The next image illustrates this.
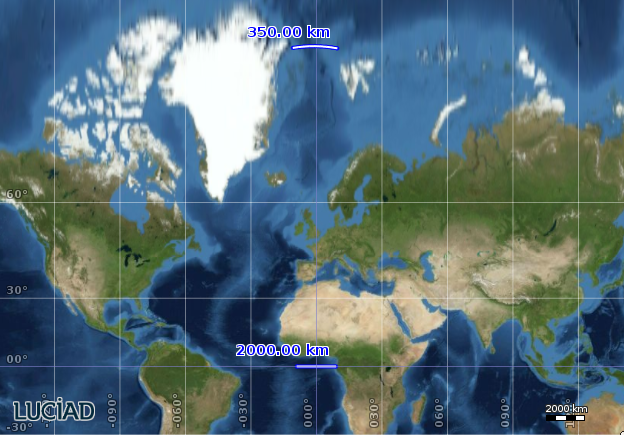
That’s why the scale of a 2D map is usually measured at the origin of the projection, because this is typically the area with the least amount of distortion.
In 3D maps, determining the map scale is even harder, which you can imagine when you look towards the horizon. Perspective becomes an extra factor in map projection and scaling. Usually the map scale is measured in a focus point on the map, meaning the center of the area you’re currently looking at.