This article is part of a series of tutorials that show you how to develop your first application:
Goal
In this tutorial, we show how to add and configure labels with textual information for the city features. We add the labels next to the feature icon. This process is also called labeling.
Starting point
We take the code written in the Style features tutorial as our starting point, and expand from there.
Step 1 - Create the painter
The FeaturePainter is responsible for styling the objects, but it is also responsible for painting and styling the object labels.
Because we already created the CityPainter in the previous tutorial, there is nothing more we need to do here.
Step 2 - Configure the label per object
To label objects in the model, the layer automatically passes each object individually to its painter
by calling the paintLabel() function.
That is why we must implement this function by configuring a label for each feature.
First, we need a label style object that describes a city label on the map.
For the points, we use PointLabelStyle. We can configure a label offset in pixels, and the possible positions
of the label relative to the object, for example north, east, south or west.
CityPainter.ts file
import {PointLabelStyle} from "@luciad/ria/view/style/PointLabelStyle.js";
import {PointLabelPosition} from "@luciad/ria/view/style/PointLabelPosition.js";

  export class CityPainter extends FeaturePainter {
    _labelStyle: PointLabelStyle = {
      positions: PointLabelPosition.NORTH,
      offset: 15
    };
    // ...
}|
By default, labels are de-cluttered, so that they don’t overlap. The |
Secondly, inside the paintLabel() function, we configure which domain object to label with which style.
Note that the paintLabel() function is similar to paintBody().
The difference is that the first parameter is a LabelCanvas, so we can draw text labels on the map.
You can retrieve the label information itself from the feature parameter, as shown in the code snippet below.
import {LabelCanvas} from "@luciad/ria/view/style/LabelCanvas.js";
  export class CityPainter extends FeaturePainter {
    _labelStyle: PointLabelStyle = { /*...*/};

    paintLabel(labelCanvas: LabelCanvas, feature: Feature, shape: Shape, layer: Layer, map: RIAMap,
               paintState: PaintState) {
      const label = feature.properties.CITY;
      labelCanvas.drawLabel(label, shape, this._labelStyle);
    };
}|
In this example, we use the |
Step 3 - Configure CSS label styling
So far, we just used a textual string for our labels. The text string was directly derived from one of the properties of the
city.
The drawLabel() method can handle any HTML markup and CSS styling properties, though, which allows for a lot of
flexibility in styling the label text.
Firstly, let’s define some CSS classes inside the dist/style.css to give the labels a nicer appearance.
dist/style.css.blueColorTick {
border-top: 1px solid rgb(0, 96, 154);
}
.theader {
position: relative;
width: auto;
height: auto;
/*border: 1px solid green;*/
}
.theader .leftTick {
position: relative;
float: left;
width: 10px;
}
.theader .rightTick {
position: relative;
float: right;
width: 10px;
}
.blueColorLabel {
border-left: 1px solid rgb(0, 96, 154);
border-right: 1px solid rgb(0, 96, 154);
border-bottom: 1px solid rgb(0, 96, 154);
color: rgb(0, 96, 154);
background-color: rgba(255,255,255,0.6);
}
.theader .name {
position: relative;
top: -0.6em;
text-align: center;
padding-left: 12px;
padding-right: 12px;
font: bold 13px arial, sans-serif;
text-shadow: -1px 0 lightgrey, 0 1px lightgrey, 1px 0 lightgrey, 0 -1px lightgrey
}
.Icao {
position: relative;
top: -0.4em;
padding-left: 4px;
padding-right: 4px;
font: bold 11px arial, sans-serif;
text-shadow: -1px 0 lightgrey, 0 1px lightgrey, 1px 0 lightgrey, 0 -1px lightgrey
}
.type {
position: relative;
top: -0.4em;
padding-left: 4px;
padding-right: 4px;
font: bold 11px arial, sans-serif;
text-shadow: -1px 0 lightgrey, 0 1px lightgrey, 1px 0 lightgrey, 0 -1px lightgrey
}
.labelwrapper {
padding-top: 10px;
}Now, we can include this CSS file in index.html. Let’s add this line into the head element.
<head>
 <!-- ... -->
 <link rel="stylesheet" type="text/css" href="style.css">
</head>
Finally, we can use those CSS classes inside the HTML label directly, which gives much prettier labels.
import {LabelCanvas} from "@luciad/ria/view/style/LabelCanvas.js";
export class CityPainter extends FeaturePainter {
_labelStyle: PointLabelStyle = { /*...*/};
paintLabel(labelCanvas: LabelCanvas, feature: Feature, shape: Shape, layer: Layer, map: RIAMap,
paintState: PaintState) {
const label = `
<div class="labelwrapper">
<div class="blueColorLabel">
<div class="theader">
<div class="leftTick blueColorTick"></div>
<div class="rightTick blueColorTick"></div>
<div class="name">${feature.properties.CITY}</div>
</div>
<div class="type">State : ${feature.properties.STATE}</div>
</div>
</div>`;
labelCanvas.drawLabel(label, shape, this._labelStyle);
};
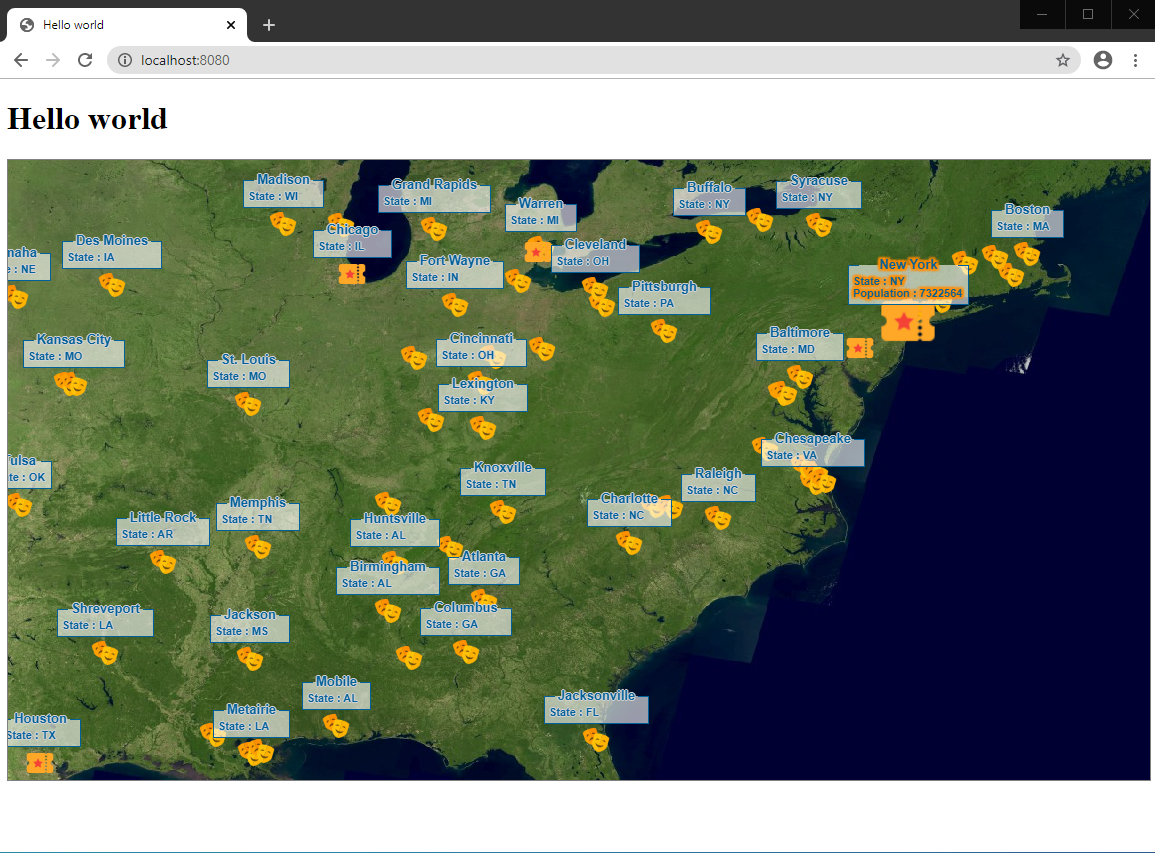
}Step 4 - Configure CSS label styling for selected features
Let’s add an extra piece of information for the label styling of selected features. We can check paintState.selected to find out if
a user selected the rendered feature.
import {LabelCanvas} from "@luciad/ria/view/style/LabelCanvas.js";
  export class CityPainter extends FeaturePainter {
    _labelStyle: PointLabelStyle = { /*...*/};

    paintLabel(labelCanvas: LabelCanvas, feature: Feature, shape: Shape, layer: Layer, map: RIAMap,
               paintState: PaintState) {
      const moreInfo = paintState.selected ?
                       `<div class="type">Population : ${feature.properties.TOT_POP}</div>` : "";
      const label = `
            <div class="labelwrapper">
              <div class="blueColorLabel">
                <div class="theader">
                  <div class="leftTick blueColorTick"></div>
                  <div class="rightTick blueColorTick"></div>
                  <div class="name">${feature.properties.CITY}</div>
                </div>
                <div class="type">State : ${feature.properties.STATE}</div>
                ${moreInfo}
              </div>
            </div>`;
      labelCanvas.drawLabel(label, shape, this._labelStyle);
    };
}|
The selection utility — the |
Full code for the city painter
CityPainterimport {FeaturePainter, PaintState} from "@luciad/ria/view/feature/FeaturePainter.js";
import {IconStyle} from "@luciad/ria/view/style/IconStyle.js";
import {GeoCanvas} from "@luciad/ria/view/style/GeoCanvas.js";
import {Feature} from "@luciad/ria/model/feature/Feature.js";
import {Shape} from "@luciad/ria/shape/Shape.js";
import {Layer} from "@luciad/ria/view/Layer.js";
import {RIAMap} from "@luciad/ria/view/RIAMap.js";
import {PointLabelStyle} from "@luciad/ria/view/style/PointLabelStyle.js";
import {PointLabelPosition} from "@luciad/ria/view/style/PointLabelPosition.js";
import {LabelCanvas} from "@luciad/ria/view/style/LabelCanvas.js";
export class CityPainter extends FeaturePainter {
_labelStyle: PointLabelStyle = {
positions: PointLabelPosition.NORTH,
offset: 15
};
_bigCityStyle: IconStyle = {
url: "./resources/bigCity.png",
width: "32px",
height: "32px"
};
_cityStyle: IconStyle = {
url: "./resources/city.png",
width: "32px",
height: "32px"
};
paintBody(geoCanvas: GeoCanvas, feature: Feature, shape: Shape, layer: Layer, map: RIAMap, paintState: PaintState) {
const style = this.isBigCity(feature) ? this._bigCityStyle : this._cityStyle;
style.zOrder = feature.properties.TOT_POP;
geoCanvas.drawIcon(shape, style);
};
paintLabel(labelCanvas: LabelCanvas, feature: Feature, shape: Shape, layer: Layer, map: RIAMap, paintState: PaintState) {
const moreInfo = paintState.selected ? `<div class="type">Population : ${feature.properties.TOT_POP}</div>` : "";
const label = `
<div class="labelwrapper">
<div class="blueColorLabel">
<div class="theader">
<div class="leftTick blueColorTick"></div>
<div class="rightTick blueColorTick"></div>
<div class="name">${feature.properties.CITY}</div>
</div>
<div class="type">State : ${feature.properties.STATE}</div>
${moreInfo}
</div>
</div>`;
labelCanvas.drawLabel(label, shape, this._labelStyle);
};
isBigCity(feature: Feature) {
return !!feature.properties.TOT_POP && feature.properties.TOT_POP > 1000000;
}
}