Goal
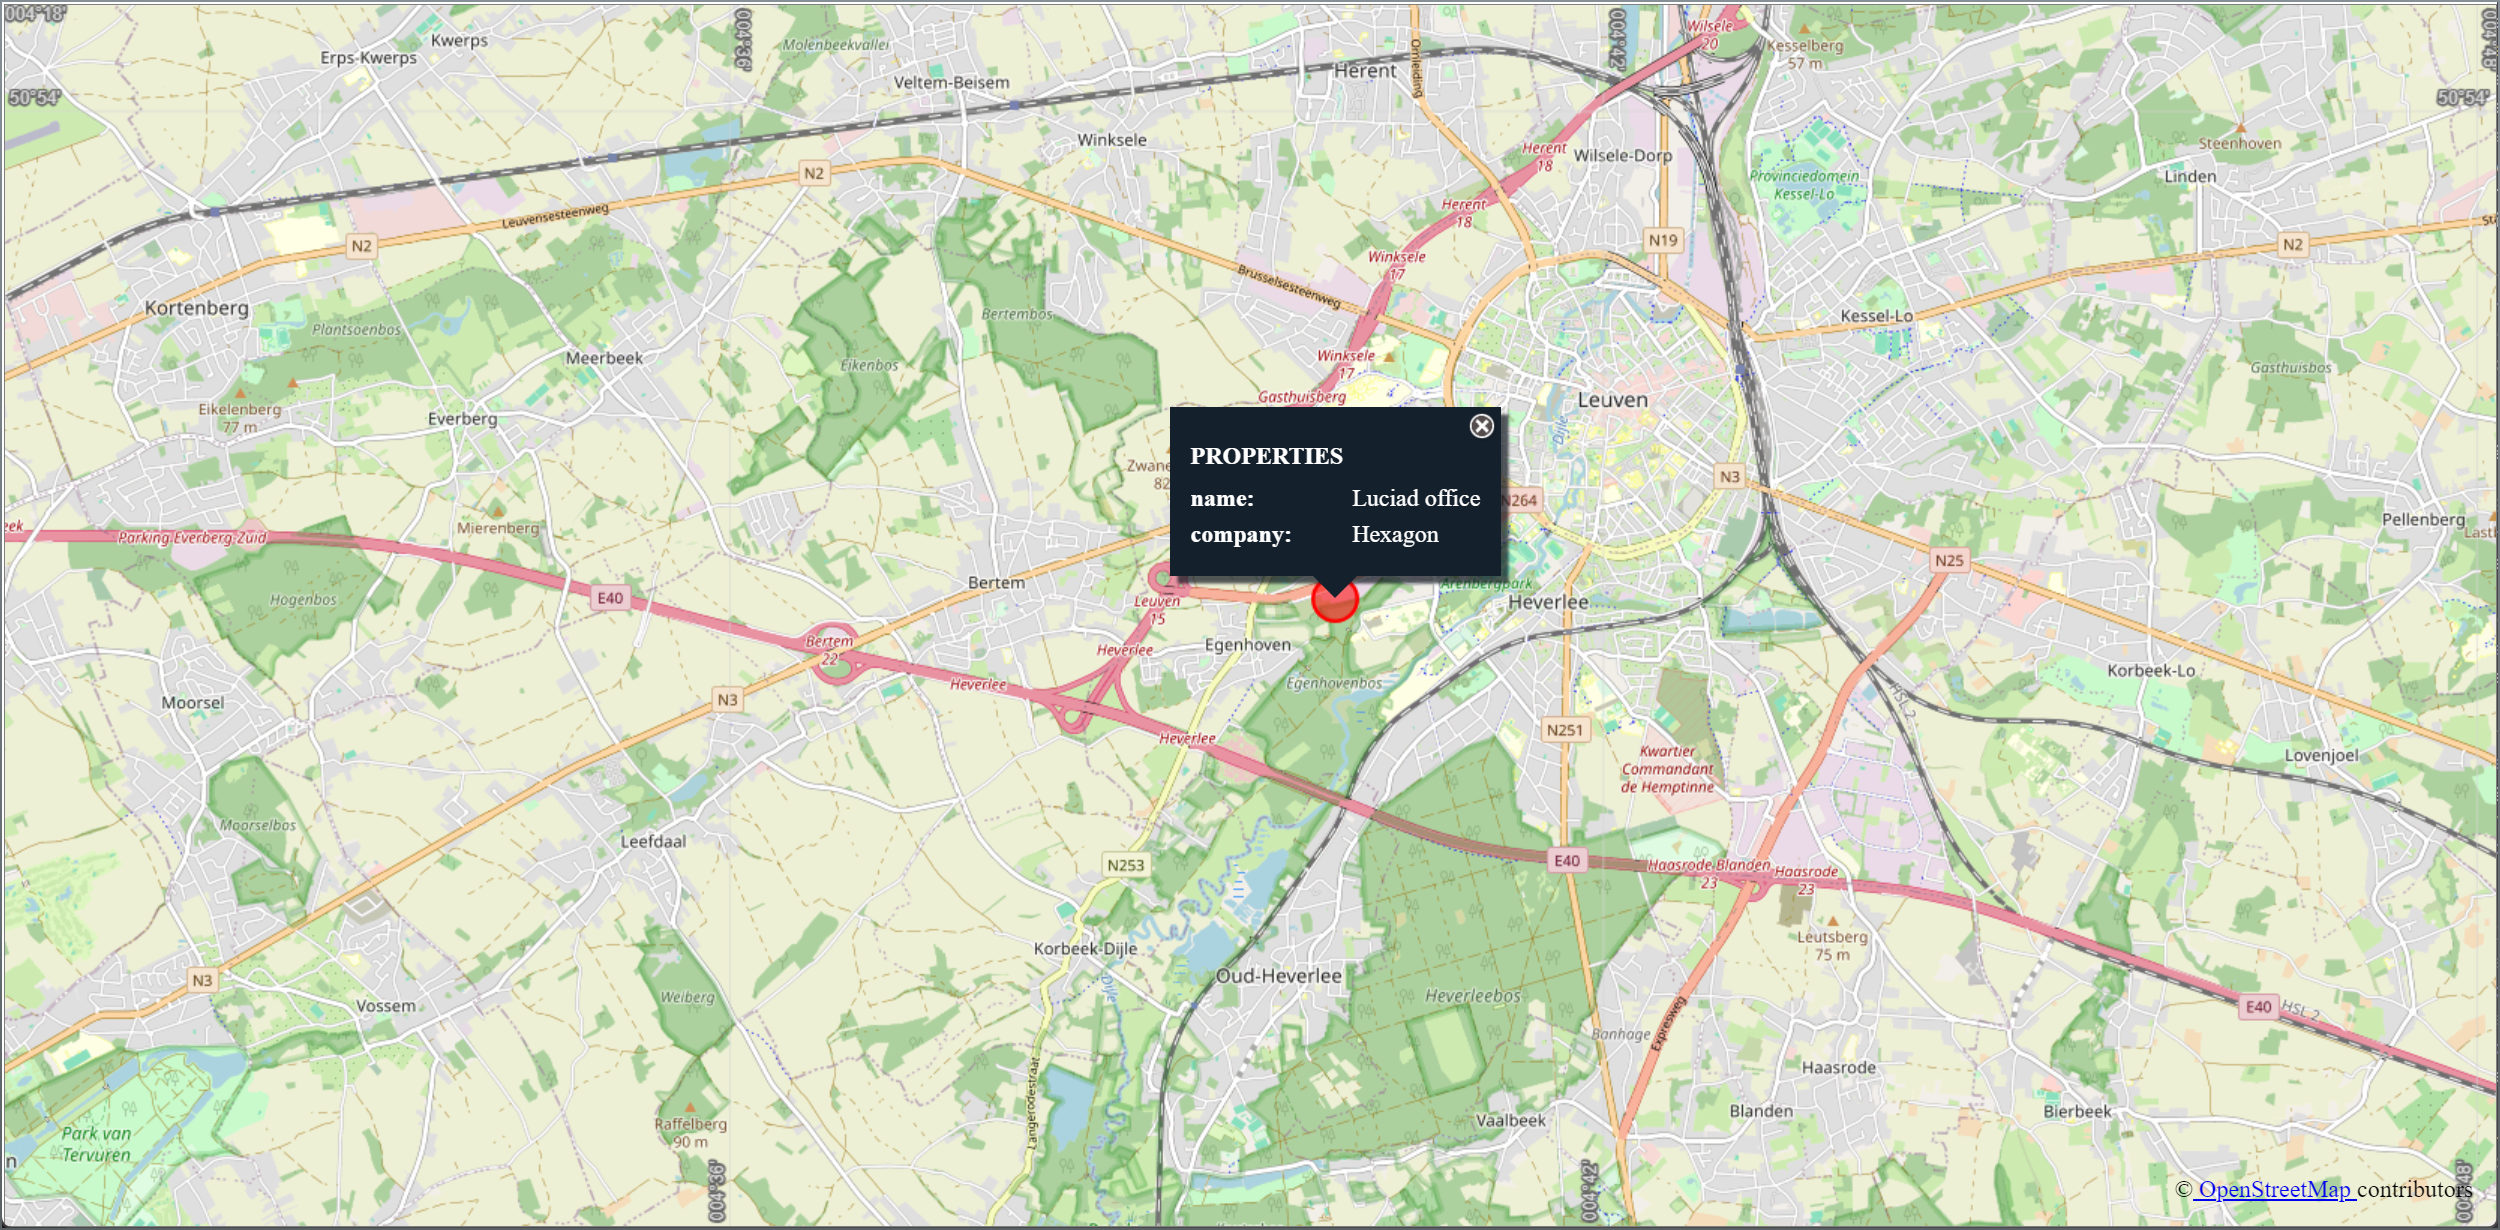
In this tutorial, we create a basic HTML page containing a LuciadRIA map. It has quality background imagery from a public OpenStreetMap server, shows a coordinate grid, and uses an icon to mark a specific location.
Setup
We use webpack and webpack-dev-server to develop and serve the app.
Project structure setup
-
We create a new project directory with an
index.htmlfile and use webpack to serve this file.We start by creating a directory, initializing npm, and installing webpack and the dev-server packages from the command line:
mkdir hello-world cd hello-world npm init -y npm install webpack webpack-cli webpack-dev-server raw-loader --save-dev -
We set up the standard webpack configuration, with a
srcdirectory for JavaScript sources and adistdirectory for the output:Creating the standard configuration files from the command linemkdir dist mkdir src # Already create some empty files, which we'll populate later # On Mac and Linux, you use the touch command to create files. # The windows command line alternative for touch is type # type nul > dist/index.html # Alternatively, you can install touch as an npm package using `npm install --global touch-cli`. touch dist/index.html #create an empty index.html file in the dist directory touch src/index.js #create an empty index.js file in the src directory touch webpack.config.js #create an empty webpack configuration file -
We make the web server serve the
distfolder. We add this content to thewebpack.config.jsfile:webpack.config.jsfile additions to serve thedistfolderconst path = require('path'); module.exports = { devServer: { static: path.join(__dirname, 'dist') } }; -
To test our setup, we add basic content to the
index.htmlfile in thedistfolderInitial contents of thedist/index.htmlfile<!doctype html> <html lang="en"> <head> <title>Hello world</title> </head> <body> <h1>Hello world</h1> </body> </html>The resulting folder and file structure looks like this:
hello-world |- dist |- index.html |- node_modules |- package.json |- package-lock.json | - src |- index.js |- webpack.config.js -
To start the development server, we add a
start:devscript inpackage.json:Add an extra script to thepackage.jsonfile"scripts": { "start:dev": "webpack serve --mode development" }Now we can run:
npm run start:dev
To see the web page, go to http://localhost:8080/ in your browser.
Installing the LuciadRIA npm packages
Your LuciadRIA distribution comes with a number of NPM packages under the packages folder.
-
The
@luciad/riapackage has the core modules of the LuciadRIA library -
The
@luciad/geometryand@luciad/symbologypackages are optional packages.
In this tutorial, we assume that these packages are already published in an npm registry. We’re going to install them using npm install.
# Install the LuciadRIA core package from your own private registry
npm install --registry http://my-private-registry:8073/ @luciad/ria

# Optional: if you purchased additional components, install them as well
# We won't be using any code from those packages in the remainder of this tutorial
# npm install  --registry http://my-private-registry:8073/ @luciad/ria-geometry
# npm install  --registry http://my-private-registry:8073/ @luciad/ria-milsym
We can now use the installed @luciad/ria package in our index.js file.
|
An alternative to using the Consult the npm documentation for more information. |
Adding a LuciadRIA map to our application
First, we add a <div> to our index.html page to mark where we want our map.
The HTML file update immediately triggers the server to load our JavaScript code.
<body> element, containing a <div> for the map and the <script> tag for the JS in the dist/index.html file
<body>
  <h1>Hello world</h1>
  <!-- Create a div where our map should appear -->
  <div id="map"/>
  <!-- Load the javaScript file.
       main.js is the file that webpack will generate for the src/index.js file
  -->
  <script src="main.js"></script>
</body>
We also add some CSS to give this <div> a certain size.
To keep things simple in this tutorial, we add the CSS directly to the header of our file:
dist/index.html file
<style>
  #map {
  position: absolute;
  top: 1px;
  right: 1px;
  bottom: 1px;
  left: 1px;
  border: 1px solid grey;
 }
</style>
The complete dist/index.html file
<!doctype html>
<html lang="en">
  <head>
    <title>Hello world</title>
    <style>
      #map {
      position: absolute;
      top: 1px;
      right: 1px;
      bottom: 1px;
      left: 1px;
      border: 1px solid grey;
     }
    </style>
  </head>
  <body>
    <h1>Hello world</h1>
    <div id="map"/>
    <script src="main.js"></script>
  </body>
</html>
Now it’s time to write our first lines of LuciadRIA code.
In the src/index.js file, we create a new @luciad/ria/view/RIAMap instance, and tell it to appear in that <div>:
import { RIAMap } from "@luciad/ria/view/RIAMap.js";
import { getReference } from "@luciad/ria/reference/ReferenceProvider";

//Create a new 2D map instance, and display it in the div with the "map" id
const webMercatorReference = getReference("EPSG:3857");
const map = new RIAMap("map", {
  reference: webMercatorReference,
});
That’s it. We created our first LuciadRIA map.
If you visit the web page at this point, you bump into two problems, though:
-
The browser shows a license error because we didn’t install the LuciadRIA license in our application yet.
-
The page doesn’t show anything because the map doesn’t contain any data yet. We start adding data in Add OpenStreetMap data as a base layer.
Installing and activating the license
To activate the license, we must pass the contents of the license file to the License class:
-
Copy the
luciadria_development.txtlicense file to thesrcfolder. -
Create a new
src/license-loader.jsfile -
Add the following contents to it:
Thesrc/license-loader.jsfile:import {setLicenseText} from "@luciad/ria/util/License.js"; import license from 'raw-loader!./luciadria_development.txt'; setLicenseText(license);We’re using the webpack raw-loader to load the contents of the license file as a string.
-
Import the
LicenseLoaderin thesrc/index.jsfile.import "./license-loader";Make sure that this import is the first import. You must load the license before you trigger any other LuciadRIA code.
Add OpenStreetMap data as a base layer
Now that the license is installed, it’s time to add some data to the map so that we can see the map.
OpenStreetMap offers worldwide free maps updated and maintained by volunteer contributors. It serves its maps as imagery data from tile servers. From LuciadRIA, you can access those tile servers and show OpenStreetMap imagery as a background layer on your map.
Access the OpenStreetMap data as a URL tileset model
OpenStreetMap offers its data through tile servers, so we create a UrlTileSetModel that applies the OpenStreetMap raster tiles settings.
OpenStreetMap tile servers adhere to the tile URL pattern http(s)://baseUrl/${z}/${x}/${y}.png. In that pattern, z, x, and y refer to zoom level, tile column, and tile row respectively. For an overview of available servers,
see How to visualize imagery from OpenStreetMap tile servers.
OpenStreetMap uses the "EPSG:3857" projection, a popular Mercator projection for web maps, so that is what use as the coordinate
reference for the bounds we are requesting.
Next, we use a RasterTileSetLayer to visualize the model in a layer. We want the OpenStreetMap data as a background layer, so we add it to the bottom of the
map layer tree.
import { UrlTileSetModel } from "@luciad/ria/model/tileset/UrlTileSetModel";
import { RasterTileSetLayer } from "@luciad/ria/view/tileset/RasterTileSetLayer";
import { LayerType } from "@luciad/ria/view/LayerType";
import { createBounds } from "@luciad/ria/shape/ShapeFactory";

// Add OpenStreetMap background layer.
const backgroundLayer = createOpenStreetMapLayer();
map.layerTree.addChild(backgroundLayer, "bottom");

function createOpenStreetMapLayer() {
  // Create a model that applies the OpenStreetMap raster tiles' settings, including:
  // - the URL pattern consisting of baseUrl/{tileLevel}/{tileColumn}/{inverse tileRow}.png
  // - a Web Mercator projection
  // - a single top-level tile
  const webMercatorReference = getReference("EPSG:3857");
  const model = new UrlTileSetModel({
    baseURL: "https://a.tile.openstreetmap.org/{z}/{x}/{-y}.png",
    bounds: createBounds(webMercatorReference, [
      -20037508.3427892,
      2 * 20037508.3427892,
      -20037508.3427892,
      2 * 20037508.3427892,
    ]),
    level0Columns: 1,
    level0Rows: 1,
    reference: webMercatorReference,
  });
  // Create a layer for the model.
  return new RasterTileSetLayer(model, {
    layerType: LayerType.BASE,
    label: "OpenStreetMap",
  });
}
For more information about adding background data to LuciadRIA maps, see How to get nice background data in your application.
Add the OpenStreetMap attribution
If you use OpenStreetMap data in your map application, you must attribute OpenStreetMap. You can add the attribution in a map overlay.
To create such a map overlay, add an extra <div> to the map <div> in the index.html file.
<body>
  <div id="map">
    <div class="attribution" id="osm_attribution">©<a href="https://www.openstreetmap.org/copyright">
        OpenStreetMap </a>contributors</div>
    <script src="main.js"></script>
  </div>
</body>
To position the attribution on top of the map, specify CSS associated with the attribution <div> class`.
.attribution {
  position: absolute;
  bottom: 10px;
  right: 10px;
  pointer-events: none;
  padding: 5px;
  z-index: 5;
}
To learn more about overlaying components on your map, see Displaying items on top of your map.
Add a coordinate grid
A typical map displays a coordinate grid, so we add one here as well. We set up a longitude-latitude grid layer with our preferred styling and scale ranges.
With the scale range settings, we determine how many grid lines we want within each scale range.
In this example, we increase the grid line density with each scale level, so that more grid lines appear when map users zoom
in. This map shows grid lines at every 20 degrees longitude and 20 degrees latitude in the scale range between 5.0E-9 and 9.0E-9.
For the styling of our grid, we set up default or fallback styling for grid lines and labels without specific styling. We also set up a specific style that shortens the coordinates in grid line labels when users zoom out into higher scale ranges.
Click here to expand the grid setup code
import { LonLatPointFormat } from "@luciad/ria/shape/format/LonLatPointFormat";
import { LonLatGrid } from "@luciad/ria/view/grid/LonLatGrid";
import { GridLayer } from "@luciad/ria/view/grid/GridLayer";

const gridLayer = createGridLayer();
map.layerTree.addChild(gridLayer);

function createGridLayer() {
  //Define scale ranges and create a grid
  const settings = [{
    scale: 40000.0E-9,
    deltaLon: 1 / 60,
    deltaLat: 1 / 60
  },
  ...
  {
    scale: 5000.0E-9,
    deltaLon: 1 / 2,
    deltaLat: 1 / 2
  }, {
    scale: 1000.0E-9,
    deltaLon: 1,
    deltaLat: 1
  }, ...
  {
    scale: 20.0E-9,
    deltaLon: 10,
    deltaLat: 10
  }, {
    scale: 9.0E-9,
    deltaLon: 20,
    deltaLat: 20
  }, {
    scale: 5.0E-9,
    deltaLon: 30,
    deltaLat: 30
  }, {
    scale: 0,
    deltaLon: 45,
    deltaLat: 45
  }];
  const grid = new LonLatGrid(settings);

  //Set the default styling for grid lines and labels
  grid.fallbackStyle = {
    labelFormat: new LonLatPointFormat({
      pattern: "lat(+DM),lon(+DM)"
    }),
    originLabelFormat: new LonLatPointFormat({
      pattern: "lat(+D),lon(+D)"
    }),
    originLineStyle: {
      color: "rgba(230, 20, 20, 0.6)",
      width: 2
    },
    lineStyle: {
      color: "rgba(210,210,210,0.6)",
      width: 1
    },
    originLabelStyle: {
      fill: "rgba(210,210,210,0.8)",
      halo: "rgba(230, 20, 20, 0.8)",
      haloWidth: 3,
      font: "12px sans-serif"
    },
    labelStyle: {
      fill: "rgb(220,220,220)",
      halo: "rgb(102,102,102)",
      haloWidth: 3,
      font: "12px sans-serif"
    }
  };

  //Use simplified labels when zoomed out a lot.
  const degreesOnlyFormat = new LonLatPointFormat({
    pattern: "lat(+D),lon(+D)"
  });
  grid.setStyle(grid.scales.indexOf(0), {
    labelFormat: degreesOnlyFormat
  });
  grid.setStyle(grid.scales.indexOf(5.0E-9), {
    labelFormat: degreesOnlyFormat
  });
  grid.setStyle(grid.scales.indexOf(9.0E-9), {
    labelFormat: degreesOnlyFormat
  });
  grid.setStyle(grid.scales.indexOf(20.0E-9), {
    labelFormat: degreesOnlyFormat
  });
  grid.setStyle(grid.scales.indexOf(200.0E-9), {
    labelFormat: degreesOnlyFormat
  });
  return new GridLayer(grid, {
    label: "Grid"
  });
}
To learn more about displaying coordinate grids in LuciadRIA, see Visualizing a grid.
Add a placemark feature
Now, we want to draw attention to a particular map location. We do so by making the map automatically zoom into the general area. Then, we mark the point of interest on the map with a large red dot.
Create the placemark
We are going to add a placemark to the location of the Luciad office. We create the office location as a point shape at the office coordinates.
To save that point along with more information about the office, we create a LuciadRIA feature of it. To be able to work with
the feature, we add it to a feature model and a MemoryStore.
A feature model allows you to manage feature data.
A Store serves a go-between for the source of the data, the computer memory in this case, and the feature model. It handles
communication and converts the features between the source data format and the LuciadRIA format.
import { createPoint } from "@luciad/ria/shape/ShapeFactory";
import { MemoryStore } from "@luciad/ria/model/store/MemoryStore";
import { Feature } from "@luciad/ria/model/feature/Feature";
import { FeatureModel } from "@luciad/ria/model/feature/FeatureModel";

const reference = getReference("CRS:84");
// Add the location of the Luciad office:
// Create a point for the location.
const luciadLocation = createPoint(reference, [4.66935, 50.8648]);
// Create a feature containing the location and some properties.
const luciadFeature = new Feature(
  luciadLocation,
  {
    name: "Luciad office",
    company: "Hexagon",
  },
  "id1"
);
// Add the feature to a data store and model.
// The model is used to manage the data.
// The store is the link between the model and the data provider, which is one hardcoded feature in this example.
const store = new MemoryStore({
  data: [luciadFeature],
});
const model = new FeatureModel(store, {
  reference: reference,
});
Now that we have feature management set up, we can turn to the visualization of our feature. We visualize LuciadRIA map data as layers, so we add the model with the office feature to a new feature layer. We want it to have a style that is distinct from the style applied by the default LuciadRIA feature painter, so we assign our own painter to the layer.
In our custom feature painter definition, we are going to use an SVG icon  to visualize the office feature.
First, we create an images subfolder in our dist folder, and add the preferred SVG icon to it.
Next, we specify that folder as the location of the SVG icon. We also specify how we want to style the point object when map
users select it.
import { FeatureLayer } from "@luciad/ria/view/feature/FeatureLayer";
import { FeaturePainter } from "@luciad/ria/view/feature/FeaturePainter";

// Add the model to a layer.
// The layer is used to visualize the data.
const layer = new FeatureLayer(model, {
  label: "Luciad office",
  painter: createLocationPainter(), // we use a painter that visualizes the data by means of an SVG icon
  selectable: true,
});

function createLocationPainter() {
  const featurePainter = new FeaturePainter();
  // Use a paintBody implementation that paints an icon at the feature's location.
  featurePainter.paintBody = function (
    geoCanvas,
    feature,
    shape,
    layer,
    map,
    paintState
  ) {
    let destinationStyle = {
      url: "images/location.svg",
      width: paintState.selected ? "110%" : "100%",
      height: paintState.selected ? "110%" : "100%",
    };
    geoCanvas.drawIcon(shape, destinationStyle);
  };

  return featurePainter;
}
Fit the map on the placemark area
Directing the map focus to a specific area by zooming and centering on that area, is called fitting. In this map application, the map automatically fits to a box-shaped area, also known as bounds, around the point of interest.
MapNavigator is the class you can use for map fitting.
To specify the bounds location for this map fit, we supply the decimal longitude and latitude coordinates of the bottom left
corner of the bounds.
With the longitude, we specify the bounds width in degrees along the X axis starting from the bounds location.
With the latitude, we specify the bounds height in degrees along the Y axis starting from the bounds location.
map.mapNavigator.defaults.snapToScaleLevels = true;

// Fit on an area around the Luciad office and the city of Leuven.
map.mapNavigator.fit({
  bounds: createBounds(reference, [4.5446, 0.23, 50.8386, 0.05]),
  animate: true,
});
Finally, we set animate to true so that the application uses an automatication to automatically fit the map at startup.
At this point, we’re ready to show our feature point on the map.
// Add the layer to the map.
map.layerTree.addChild(layer, "top");
Add a balloon with feature information
We want to show feature information with the feature.
We’re going to use a balloon for that. For the balloon contents, we’re getting the properties stored with the office feature.
We set up a BalloonContentProvider function with the office feature as its parameter.
For the balloon content, we make it return a HTML table element with the table rows filled with the feature properties.
// Add a balloon content provider for the layer, capable of showing properties for a selected feature in a balloon.
layer.balloonContentProvider = (feature) => {
  let content =
    "<table style='width:100%'> <tr> <td style='vertical-align: top; padding:2px; padding-bottom: 6px; font-weight: bold;'> PROPERTIES </td> </tr>";

  const properties = feature.properties;
  for (const property in properties) {
    if (properties.hasOwnProperty(property)) {
      const propertyText = property.replace(/_/g, " ");
      content += "<tr style=''>";
      content += `<td style='vertical-align: top; padding:2px; font-weight: bold'>${propertyText}:  </td><td style='vertical-align: top; padding:2px'> ${properties[property]}</td>`;
      content += "</tr>";
    }
  }

  content += "</table>";
  console.log(content);
  return content;
};
You style a LuciadRIA balloon with CSS. In this application, we added the CSS styling to index.html.
Click here to expand the balloon CSS styling
.luciad .lcdBalloon {
      z-index: 400;
    }

    .luciad .lcdBalloon .lcdFrame {
      position: relative;
      color: #ffffff;
      background-color: #15202d;
      -webkit-box-shadow: 5px 5px 2px rgba(13, 20, 28, 0.7);
      box-shadow: 5px 5px 2px rgba(13, 20, 28, 0.7);
    }

    .luciad .lcdBalloon .lcdHeader {
      width: 100%;
      height: 20px;
      margin: 0;
      border: 0;
      padding: 0;
    }

    .luciad .lcdBalloon .lcdContent {
      width: 100%;
      max-width: 280px;
      padding: 0 10px 0 10px;
      overflow: auto;
      box-sizing: border-box;
      word-wrap: anywhere;
    }

    .luciad .lcdBalloon .lcdClose {
      position: absolute;
      width: 20px;
      height: 20px;
      top: 3px;
      right: 3px;
      background-image: url("data:image/png;base64,iVBORw0KGgoAAAANSUhEUgAAACAAAAAgCAYAAABzenr0AAAAAXNSR0IArs4c6QAAAAZiS0dEAFUATQBNeZ/YegAAAAlwSFlzAAALEwAACxMBAJqcGAAAAAd0SU1FB9wHEQ0yK7q5pHwAAAd2SURBVFjDxZd7TFv3Fcc/99q+YGwwDzt2wMQJhJTVeUGTBlWNxMLSobbS2qxNomYTsI7SJqF/EEVBSxmq6PZHplVUrSpVqTIpSChL1CjbFEVElNAGVXmMMFCrLGsoTpSHr82jZtyAMb53f+TauziQsr92pJ/uvfZP53zP+xyB/52ERd4BtEXel8RsKfcE/YgpvxkFaoCqP7UfAiMsUbhoOGb9aTIAwiAwrgOY05+qAdDjAWjaf+8IgmDU1pybmyv19fVVuVyuZ6xW60ZJklabzWYPQCwWk6PR6PDk5OTQyMjIlerq6guKoswCMf0kwGiapmkPWS9AmqYlQAi6hhJgCwQCv5qamjqrLZHGx8e7+vv79wHLgVzApvMypSr9iAV0zUXA3N3d/UR5efne7OzsOkEQpEgkQufx41zo7gbdWqIooqoqP33hBZ6trMTj8eBwONA0bfbevXudJ0+ePNbU1HQDmAGiRmssFANJ4QMDA5tKSkqabTbbi4qi8KejR/lHfz+TkcijftRNmpWdjW/VKn62YwdFxcXYbDbGxsbOnz179sOampq/Aw9SQZhSeCU0L92wYUOrzWZ7UZZlGmpquDUyQjQafWy0RmdmkO/f58ueHrw+H1arFZfLVez1ep0Oh+NGT09PJDVLUnPaBKSNj4//MScnp0GWZRrr6wGwZ2aS6XDw78lJZqanmYvFFk4ZQUi4krLNm6mrr8ftdnP79u3jPp/vXWAKUHRLxMVU0wcCgV3Z2dl1iqJwYP9+ABw5Ofz4uec4cOgQksWyqHCX201zaytOlwtN07h25QrvHj6MoigUFhbu7u3tfQmwAmmJdBaN5s/NzZWcTufPBUGQPnz/fWZ1kxeXlFC5bRvewkLajhxhXVlZ0u8mkwmTyUSWw0FDYyNPlJZy5IMPKNu8GYDRUIjG+noEQZD8fv/zkiQlAFiMAARA7Ovrq7LZbM9HIhEC332XRFZQWMjy5csRRRGXy0X9W2+xrqwMgHg8TpbDwaGWFkpLS8nIyMBut/PLujrMFgsAiqIQiURwOp1VnZ2dW1MBJAqO2eVyPQPw2+ZmxsfGkgAuXbxIIBBIfns8Hl5/4w3Wl5cjSRIvvfoqK3w+JElCVVVCoRB379whPjeXTO/ftbYC4Pf7n9JrggUwmw3RL1qt1o0A9+/enefbcCjEb5qa2LZ9O282NgKwPD+fPTU1PFAUVhUVkZaWBkDw/n0+7+7mwvnz8yrrPZ2n0+l8Uve/BRDNxgyQJGn1og1BEPh6aIjr16+zcuVKrFYrPp8PQRAQBAFVVRkdHeVf337L3z77DFLKbUwPXLvdvlLPNhNgmtfVErV9sTIdkmVOdHQwNjqarIKJYIxEIlzr7+fYxx+TkZGRrJQGBgBIkrTM2FHFlDb7WEpLT2c0HEaYlzwkg3F6ehpPQQHRaBRxgTspNUcABHOKmWRJknypt0VRJCsri4IVK9ixaxd5ubkAzM7OIggCFouFvLw8tlRUYLFYuPLVV/zzm28WrpbRaNj4bTb28mg0OrwQAFVVEUwmXt65k6KiItLS01FVlVu3bqGqKsXFxZjNZvLz8zGbzcTj8UcA5Hu9AExNTQUMs4MmGqeWycnJIYBNFRXzgijP6eTg4cOsW7cOm80GwMTEBIcPHKDl4EEufvEF8XgcgGXLlvHs1q38pLp6XqN68+23AQiFQteN/UA0WCA+MjJyBaBh3z5y8/KSfnzltddYvXp1ss6Hw2Fam5uTAE90dDB88yaqqj4EnJfH6w0NxhaPx/MwvgcHBwf0qSlu7AUqoFZXV1+YmJg473A4WLt+fTKPT584kdRQlmXea2khJMtJAJHvv+edgwf5src3KfT0qVPJ/99pa8PhcCDL8oXa2trLejuOAapo8MecoiizIyMjf9U0bbauvp5NFRVYJIlwKMRfTp8mEonwXksLcjD4SIwAHPvkExRF4fOuLk51dgKwc88eioqLUVU1NjAwcD72sCAkxrU542RrBtIB+507d35fUFBQK8syQ4ODHP3oIwAsFkuyoCyFXt65k23bt+N2u7l582ZnSUnJH4BpYFJvyzOmBUYz0ev13l2zZk2By+UqttvtXL18mejMDHN6bf8hyszMpH7/fjZv2YLb7SYYDPa0t7d/eunSpTF9KkpMRnHTQgy6urom/X7/Xa/X63S5XMWVVVWs3bCBr4eG0FT1oc90s6dSSWkpv967F//ateTk5BAMBns6Ojo+bWtru6Fr/0B/xgDVtJgWZ86cCTscjhs+n09wOp0/cns8pq2VlZQ//TTXrl5lZnoaURSTgVpQWMgv6up4ZfduVvh8mM3m2PDw8J/b29sTwmf0SWhaj4H4QrtCciwDsgAPUNTb29sUDoe7lzqWB4PBnnPnzjUDGwE/UKTzytJ5J8fzx47l+uV0wCpJkrWzs3Or3+9/yul0Pmm321fqjYVoNBqempoKhEKh64ODgwO1tbWXDdE+o2u9pLE8dTw36X07zXAkHdzjVrM5XXjUcGKGtU1bym44bzXTgRiPKWVJTZTXuGEle2Q1S/X7/305/Q/H5GXQxE4tGAAAAABJRU5ErkJggg==");
      background-size: 100%;
      -moz-background-size: 20px 20px;
    }

    .luciad .lcdBalloon .lcdClose:hover {
      background-image: url("data:image/png;base64,iVBORw0KGgoAAAANSUhEUgAAACAAAAAgCAYAAABzenr0AAAAAXNSR0IArs4c6QAAAAZiS0dEAP8A/wD/oL2nkwAAAAlwSFlzAAALEwAACxMBAJqcGAAAAAd0SU1FB9wHEQ0qKziiPCUAAAbgSURBVFjDxZdNTBvpGcd/M7YHjA02MANOINhrQkwxNNlkFZJ0V6qUC1rtYaUe2lvYXiq1t5z2VlWReqkqIfW66qGRkJpTVCmKEkWErThkP1LibBI2XRucyM7aHsD4YzBj45keMp6ODUnoqY/0akb2vM/H+z7P8/8/Av+7CG94BzDf8H4kZUf5TrCW2PGb06AJGNbTfJczwhGNi47ltp4uh0M4DDYtB/atp+Fw6O0OmOZ/vxEEwRmte2BgQFpZWbmsKMolr9d7RpKkk263OwTQaDTyuq6nyuXy442Nja/n5ubua5pWBxrWajljmqZpvlZ9iJim2XJCsCKUAF86nf51tVq9ZR5Rtre37zx8+PB3wDFgAPBZulydQR84AStyEXDfu3cvdvbs2d8Gg8HPBEGQSqUSuVyOTVVlZ2cHTdMA8Pl8BINBZEUhFAoRCAQwTbP+6tWrxRs3bvz16tWrz4E9QHeexmE5YBtfXV39YGJi4nOfz/eJpmmsp1Kk02kqlcpbE6a3t5dIJEJ0fByfz8fW1tbdW7du/eXKlSvfArudTrg69rcinzx9+vTvfT7fJ/l8nseJBMlkknq9/s6MrdfrFAoFqpUKXq8XRVHGR0dH5UAg8HxpaanUWSWdNe0Cura3t//c39//m5ZxVVVfeyeKGIbxRuOiKOL1eu2rURSFn54+zfDwMC9fvvxbOBz+A1AFNOskmmLn0afT6V8Gg8HPNE3j+7U1VFVFEAT6+/u5dOkSvb29b3TA5XIxNjbG0NAQAKqq8v3aGpqmceLEiV8tLy9/CniBrlY5i84ABgYGJFmWfyEIgrSeSpHNZgGQZZnpmRlGT5zgwsWL+P3+A8Z9Ph+xyUlik5NcuHgRWVEAyGazrKdSCIIgxePxjyVJajngcTogAOLKyspln8/3calUIp1O28r39/c5duwYoiiiKArnZ2fp7euz/+/u7mZqaorJyUl6enrw+/1MTU3Z/6fTaUqlErIsX15cXPyo04FWw3ErinIJIJfLtWV7pVJpcygUCvHBuXP2dbwXjTIWDiNJEoZhUCgUyGYybftzuRwA8Xj8nNUTPIDb7ch+0ev1ngHYtJLOeQJPvvsOo9nkVCwGwLHjx5memWFX03gvGqWrqwuA3I8/kkgkKJVKbTo2VZVYLIYsy1PW/XsA0e2sAEmSTgLs7OwcuOPd3V2ePHlC0zCIRCJ4vV7C4TCCICAIAoZhsLm5yb9/+IFisXhgf0un3++PWNXmAlxtqNbq7a0y6pS9vT0Sjx6xtblpl12rr5dKJf718CF566g7paVTkqQhJ6KKHTD7TnG73QhtxfNams0mtVqNZrN5VHgXnA7QQrVWSR0mkiQRm5xkcGDA7nqNRgOAwcFBZi9coM9RHZ1lCqDrutrZem0s13U9BRAMBg90uJ6eHk7FYkSjUbq6uzEMgxcvXrC+vs7+/j6CIHD8+HHOz84eGkBLZ7VaTTu4gyk6WUu5XH4M2E3EuXl6ZoaZmRlbebFYZD2VIvHoEalUyj76oaEhfvbhh3R3d7fpaOksFAprTjxwnkBzY2Pj61adO1uux+NhbGwMQRAwTRNVVXn29CnFYtEu0VQyaePE4OAgZ95/vw0hQ6EQAIlEYtViTU0nFhiAMTc3d79YLN4NBAJEIhFbgaqqdl3n83m+/eYbMpmMbVDXdZ48fUoymQSgVqtRrVbt/ZFIhEAgQD6fvz8/P/+VBccNwHA77mNf07T6xsbGP4LB4M+j4+PS9vY22WwWwzD455dfcn52lkwmQ7lcbqNvAHu1GmvPntFoNCjk8zaCjoyMEB0fxzCMxurq6t3G66xt0bV9J7N1A92AP5PJ/HFkZGS+E479fj+6rtuZf5h4PB6azSaGYbTBcTKZXJyYmPgTUAPKFizvuQ6hZuLo6Gj21KlTI4qijPv9fuq6TqVSoV6vv5UPABiGgWmajIyMEJ+eZnh4mFwut7SwsPDFgwcPtixW1GJGTddhSu7cuVOOx+PZ0dFRWVGUcUVRkDwearXaO1lRb28vsViM+PQ0/f395HK5pevXr39x7dq151b0u9azARiuNym6efOmGggEnofDYUGW5Z8Mh0KuUChEX18fksdjdz9RFO0sPzkxQXx6mrFwGLfb3UilUn9fWFhoGd+zmFDNyoHmYbOCTcuAPiAERJeXl6+qqnrvqLQ8l8st3b59+3PgDBAHopauPku3Tc/fSsutj7sBryRJ3sXFxY/i8fg5WZan/H5/xAIWdF1Xq9VqulAorCUSidX5+fmvHNm+Z0V9JFreSc9dFm53OZZkOfe20WzfMq47VsMxtplHmQ3bRjPLEedydQyprfbadIxkB0azznv/vw+n/wGOuWMTSTPMuAAAAABJRU5ErkJggg==");
    }
Finally, we show the balloon on the map:
// Show a balloon for the Luciad office feature.
map.showBalloon({
  layer,
  feature: luciadFeature
})
For more information about adding balloons, see How to add balloons to your map.
|
Instead of balloons, you can also use LuciadRIA labels to show feature information or other text. See Labeling feature data. |