The visual quality and performance of your point cloud display depends on various factors:
-
The number of points loaded.
-
More points mean more detail. If there are more points, you can have smaller dot sizes.
-
More points can also lead to lower fluency and performance.
-
-
The size of the dots on screen.
-
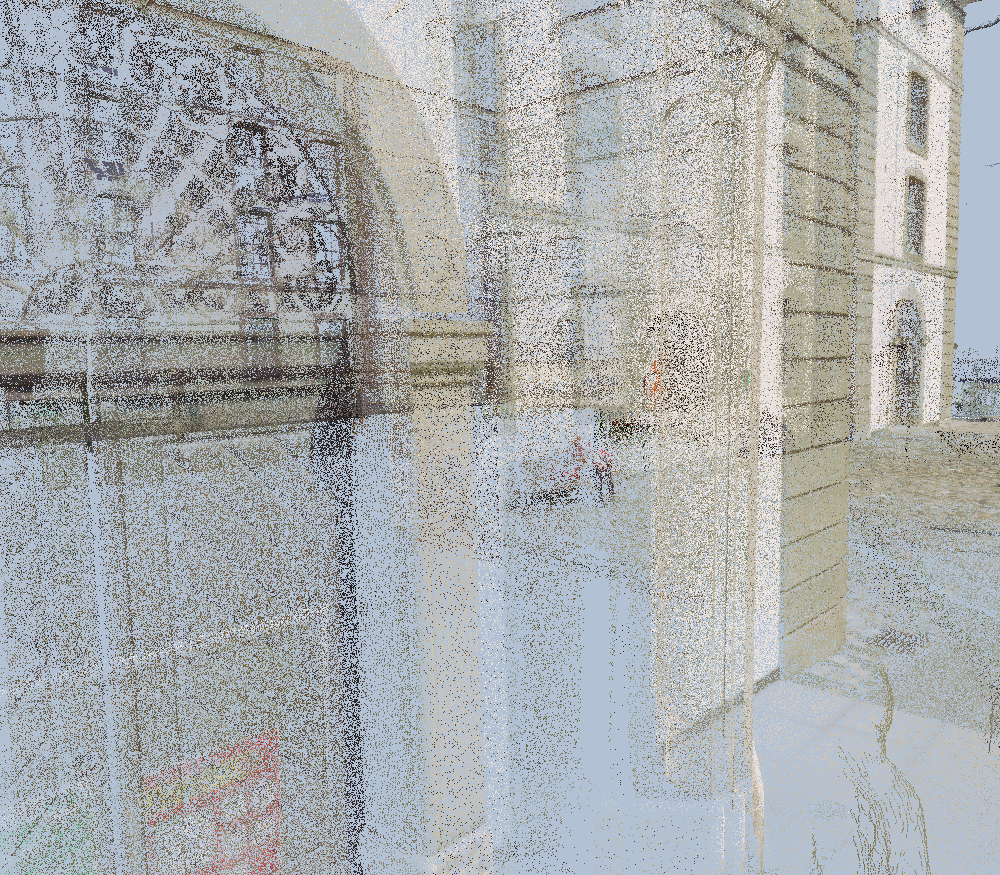
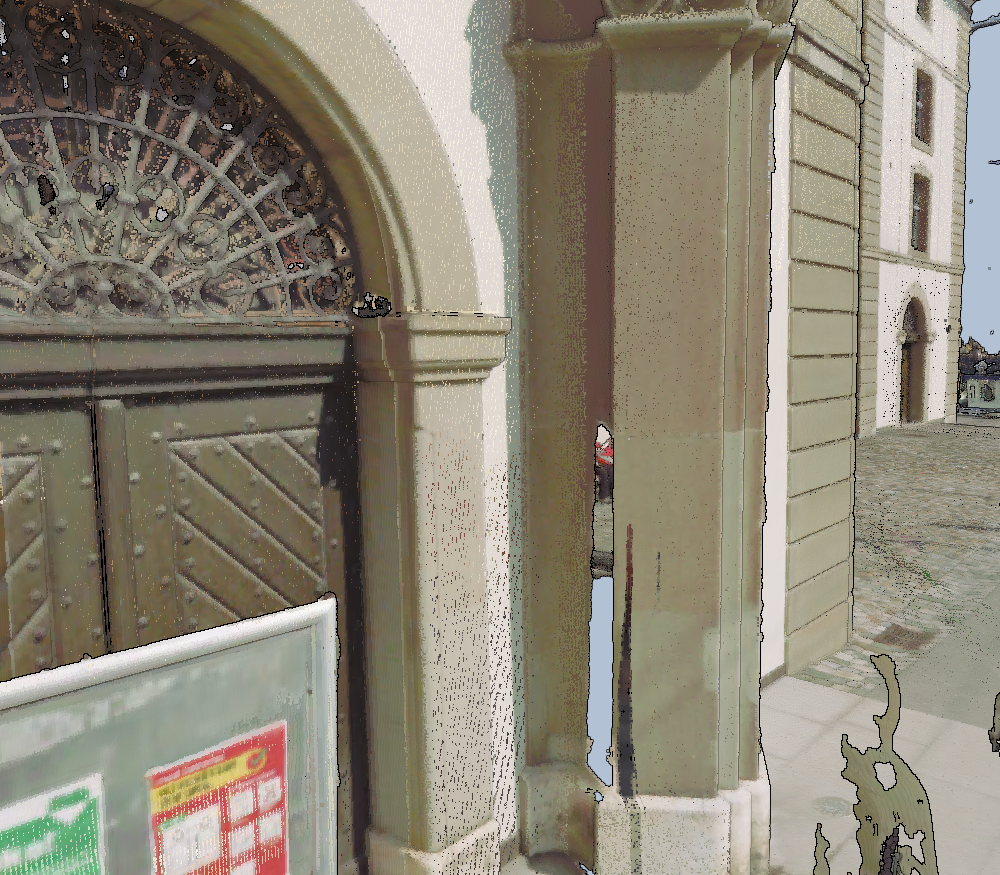
Smaller dots give you better detail if you have enough point density, but can result in a sparse point cloud if your density is low.
-
Larger dots give you a visually closed surface, but can cause an impression of lower detail and lower performance.
-
-
Other visual effect settings.
-
The graphic effect settings on the map can have a major impact on visual presentation.
-
You have access to some point-cloud-specific effects too.
-
LuciadRIA does its best to find a good balance between these factors. It also offers various options to optimize visual quality and performance for your dataset, hardware, and use case.
Recommended settings
To get the best visualization out of your point clouds, you can configure various options
You can find detailed descriptions of all the settings further on. In this section, you can find our recommendation based on some usage profiles.
| Quality level | Quality factor | Point count limit | Gap fill | Blending | Point size | Usage |
|---|---|---|---|---|---|---|
|
Low |
|
5M |
|
|
|
Mobile devices |
|
Medium |
|
10M |
|
|
|
High-end phones & tablets, low-end laptops |
|
High |
|
15M |
|
|
|
Mid-range laptops |
|
Ultra |
|
25M |
|
|
|
Laptops with gaming hardware |
layer.qualityFactor = 1.5;
layer.performanceHints = {maxPointCount: 15000000};
layer.pointCloudStyle = {
  pointSize: {mode: ScalingMode.ADAPTIVE_WORLD_SIZE, worldScale: 1.0, minimumPixelSize: 1},
  pointShape: PointCloudPointShape.DISC,
  gapFill: 2
};
Detailed settings information
Choosing the right point size
LuciadRIA offers dot size modes for point clouds. For more details, see PointCloudStyle.pointSize.
Note that you can also influence the point size with the scaleExpression option.
Using pixel-size mode
In this mode, you specify the dot size in pixels. All dots have the same size in pixels.
This mode works well for point clouds with additive refinement, such as HSPC.
Using world-size mode
In this mode, you specify a dot size in meters. Dots closer to the viewer will be larger than points farther away.
This mode helps you maintain a visually closed surface when zooming in close to the data, and retain details farther away.
You can also specify a minimum point size.
Use this mode if you know the rough inter-point distance in your dataset. This mode works well for point clouds with additive refinement, such as HSPC.
Using adaptive world-size mode
In this mode, LuciadRIA deduces a dot size in meters per tile.
With this mode, your aim is to display the right amount of detail at all times, no matter if you are close to the data or farther away.
You can also specify a minimum point size, as well as a scale factor to further tune the dot size.
We recommend using this mode for all point clouds, whether produced by LuciadFusion or in HSPC.
Adjusting the number of points loaded
LuciadRIA uses the scale information present in the source data to determine what tiles and level-of-detail to load at any given moment.
Sometimes the scale information in datasets isn’t well-configured though, making it difficult to choose the right level.
You can adjust the amount of detail loaded using the qualityFactor settings on TileSet3DLayer.
The default is 1.0. Increasing the value results in the loading of more data and detail. Decreasing the value reduces the amount of data.
These are our recommendations for use of the quality factor:
-
If you see sparse points, visible edges between tiles of different level-of-detail, or visible switches in level-of-detail when you are navigating, increase the
qualityFactor. -
If you experience bad performance, or even browser crashes due to memory overload, decrease the
qualityFactor.
Limiting the number of points in a point cloud layer
When map users visualize a large dataset, the number of points on the screen can grow rapidly. Too many points on the screen may cause a drop in performance.
You can limit the number of points displayed for a layer using the TileSet3DLayer.performanceHints.maxPointCount property.
// Creates a layer that can display up to 5 million points.
const layer = new TileSet3DLayer(model, {performanceHints: {maxPointCount: 5e6}});

// These two lines are equivalent, they remove the limit of points
layer.performanceHints.maxPointCount = null;
layer.performanceHints = {maxPointCount: null};
Adjusting your map’s memory budget
When you are working with large and detailed datasets, we recommend tuning the allowed GPU memory usage for your map. By adjusting the memory budget, you can get the best detail and performance for your dataset on your target hardware.
See Adjusting your WebGLMap memory budget to learn how to do this.
Setting graphics effects
Using one or more of our graphics effects can have a big impact on the visual end result of your point cloud.
Using map graphics effects
The map effect eye-dome lighting can significantly enhance the visual depth perception of your point cloud.
See Configuring WebGL Map effects for more information.
Using spheres as dots
When using PointCloudPointShape.SPHERE, you can use large dots with lots of overlap, and still maintain accuracy and detail.
Note that this option can have a big impact on performance. The performance depends greatly on the hardware, in particular the GPU model.
In general, we recommend to use small dot size in combination with PointCloudPointShape.DISC for optimal performance.
See PointCloudStyle.pointShape for more details.
Orienting points
The HSPC and OGC 3D Tiles point cloud format supports normal vectors at the points. Together, a point and its associated normal
vector help LuciadRIA define the surface plane the point resides on. To find out if a dataset has normal vector values, you
can use the hasNormalData property on HSPCTilesModelDescriptor and OGC3DTilesModelDescriptor.
If your dataset has normal vector values, LuciadRIA automatically orients the points so that they visualize the surface they
were captured on. You can turn it off by setting the normalOriented property of PointCloudStyle to false.
Note that enabling normal oriented points can have an impact on performance. The performance depends greatly on the hardware.
Oriented points reveal extra information about the point cloud data. However, the point orientation technique introduces more holes between the points. That’s an expected outcome. To fill up those holes, increase the point size or use the gap-filling effect.
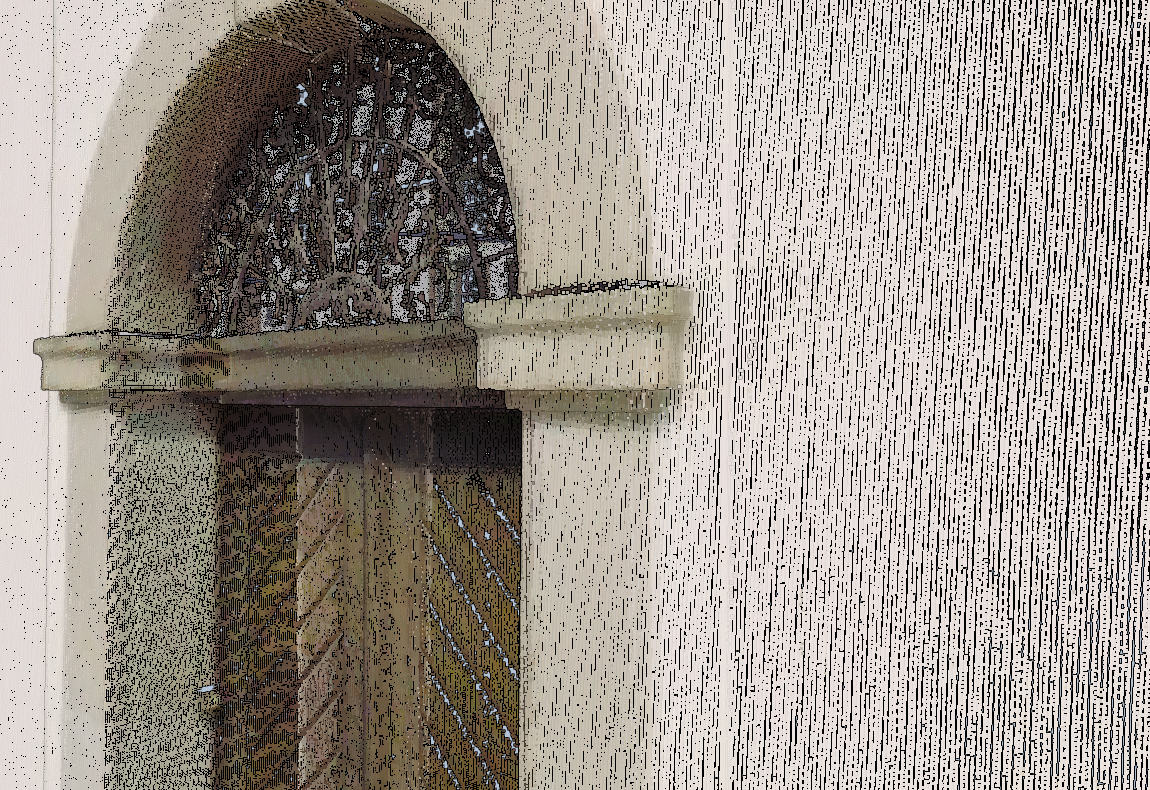
Post-processing to fill gaps
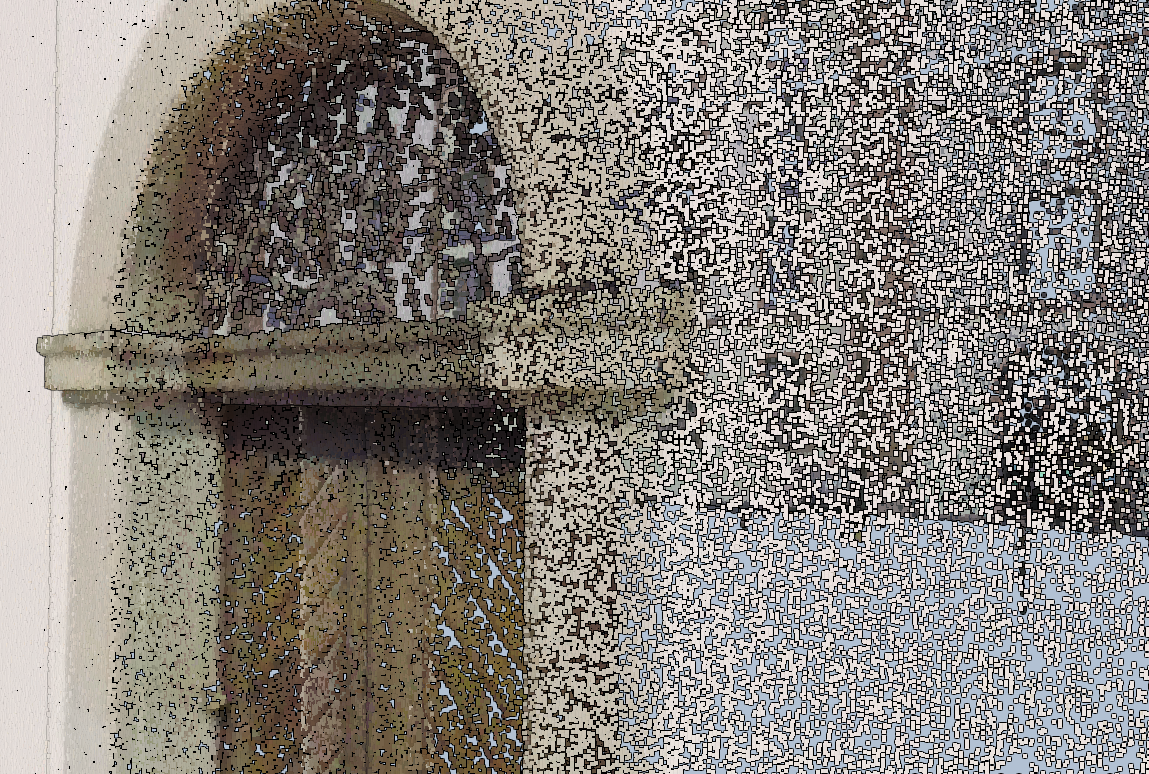
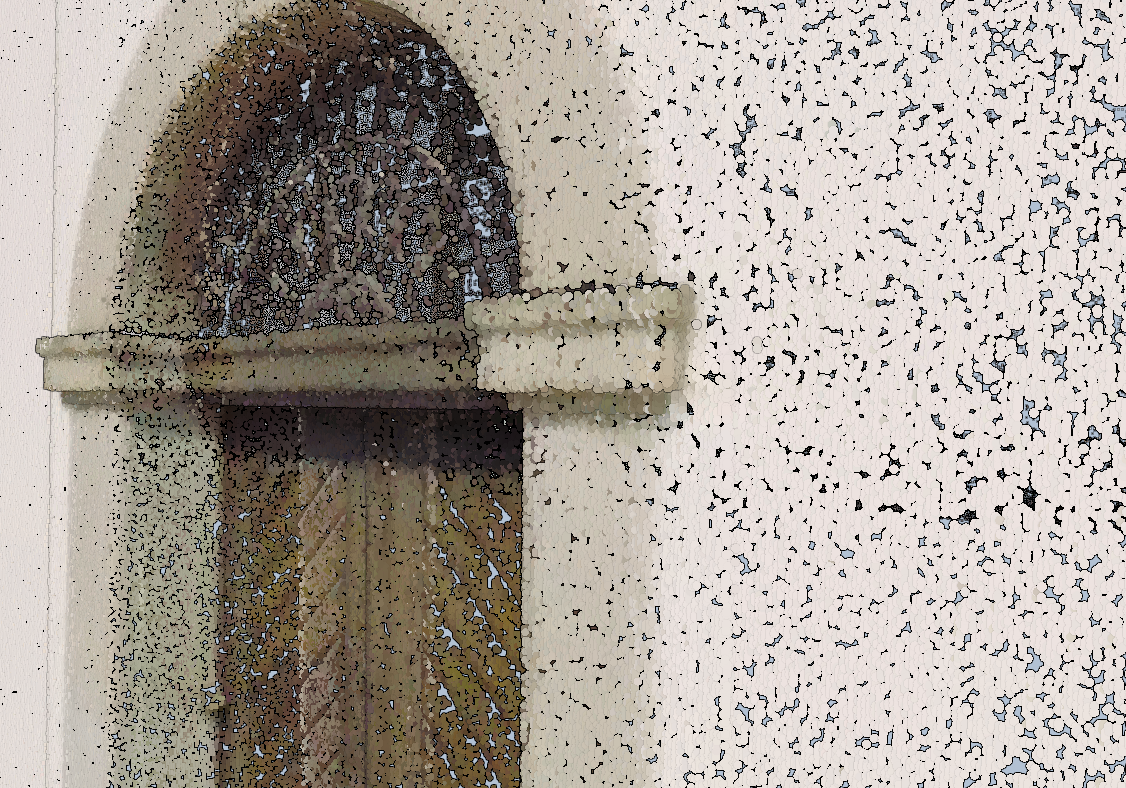
You can enable a post-processing effect that intelligently fills small holes and gaps between your points.
This effect is highly suited to high-density datasets because it allows you to use small point sizes, thus retaining visual detail, but also providing a visually closed surface.
This effect has low overhead. It works best for small gaps of 1, 2, or 3 pixels. You can also use it for larger gaps, but the quality can degrade in those cases.
See PointCloudStyle.gapFill.
Blending
Blending is a post-processing effect that smooths the point cloud. It increases the visual quality at a certain performance cost.
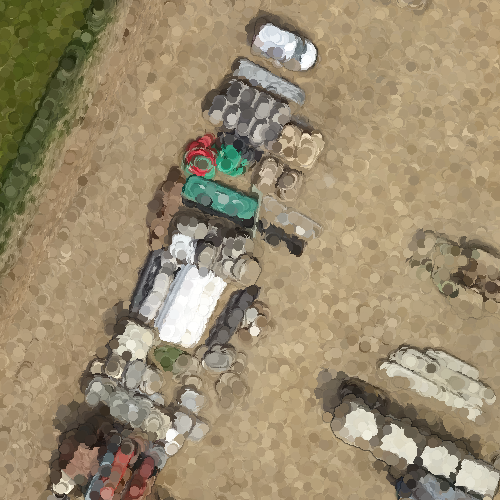
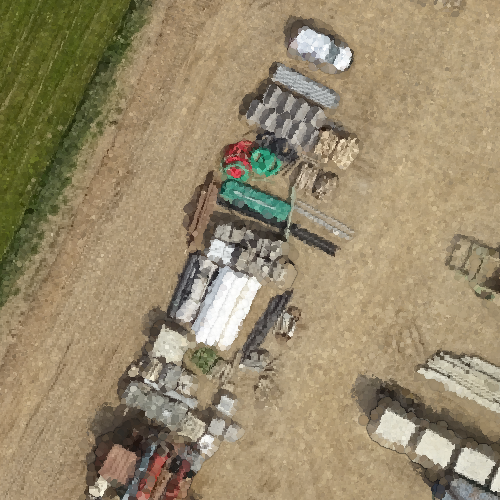
Datasets with multiple scans from distinct sensor positions often display color variations. These variations show up as stripes in the points cloud. You can use blending to reduce this side-effect.
To activate blending, set PointCloudStyle.blending to true. To adjust the blending effect, you can change the point sizes. Increasing the size of the points leads to more overlap and smoother surfaces. However, setting an excessively large point
size may create a translucent effect and could negatively impact performance.
|
If you enable blending, transparency will be ignored. |
Working with transparency
If your colorExpression adds transparency to your point cloud, you must tell the layer to take this into account.
See Showing transparent colors on meshes or point clouds for more information.