About this release
The 2025.0 release of LuciadCPillar focuses on interactive visualization. The main new features are instant Line-of-sight previewing and parameterized point styling. Additionally, we remain committed to offering wide format support by allowing LuciadCPillar applications to connect to Luciad Tile Services (LTS) for elevation data, and by updating the HERE Maps support. The release also includes various smaller improvements that enhance the developer experience.

Benefits of the new features
Instant Line-of-sight preview
LuciadCPillar now offers the capability to compute a line-of-sight from a center point to its surrounding area. Assuming that the maximum range of visibility is the same in every direction, the area is defined as a circular coverage.
With this new feature, LuciadCPillar covers the use case of gaining an immediate impression of the line-of-sight for a given observer position, height and visibility range, based on the elevation data available in the view. This line-of-sight result is dynamic: changes in the parameters and changes in the available elevation data will trigger an update. For example, when the user navigates the view, the application may load additional elevation data. Parameters can change because of user actions, or automatically, because of position changes of the observer.

Sample code/documentation to get you started
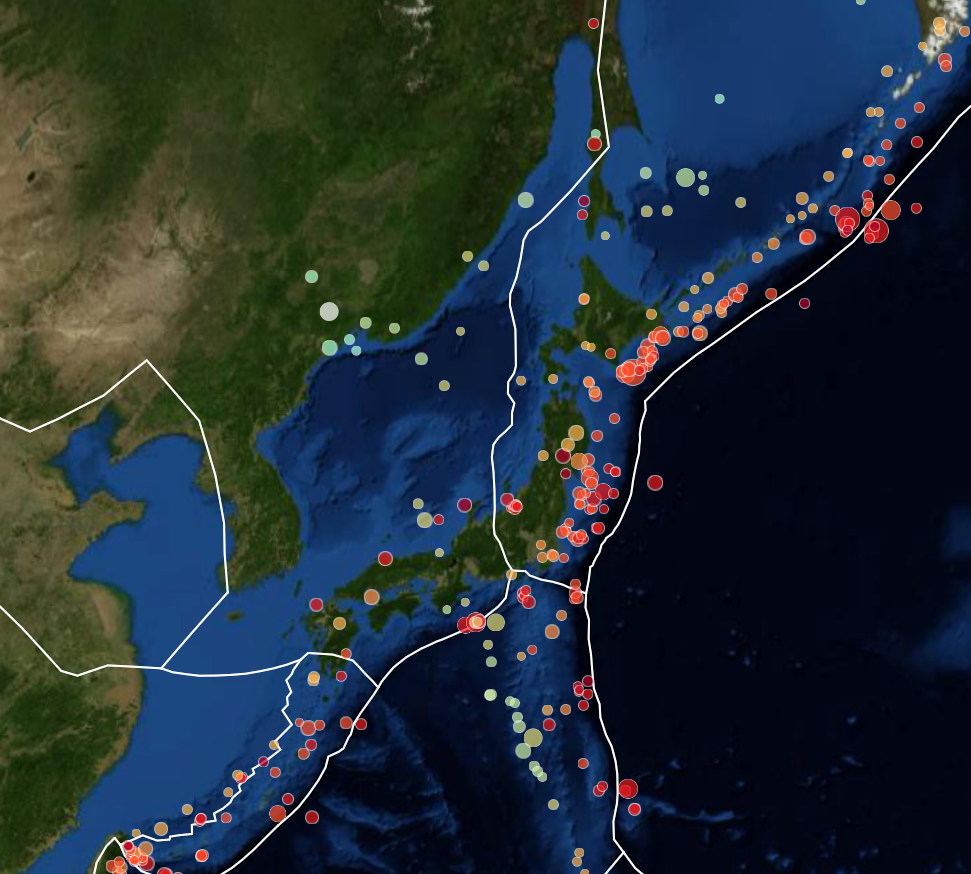
You can experiment with this feature using the Line-of-sight sample, shown in Figure 2, “A calculation of the line-of-sight from an observer to its surrounding area”. It pre-loads elevation data and allows you to add observers. Note that this sample is available for C++, C# and Android. To help you integrate this feature into your project, we added the article Visualizing line-of-sight.
Parameterized point styling and filtering
This release adds parameterized point styling and filtering to LuciadCPillar. Parameterized styling and filtering is a unique concept throughout the products of the Luciad portfolio. It involves the use of style expressions to specify how to display features. LuciadCPillar evaluates these expressions on the GPU, on each frame, for an entire group of features. The main advantage of this approach over non-expression-based feature styling is that values in the style expressions can adapt continuously with almost no overhead. This means that you can efficiently perform style updates for many features. A typical use case is the display of radar plots.
The power of style expressions
Style expressions offer a tool to control several aspects of feature visualization:
-
The icon used to visualize the point
-
A modulation color to apply to the icon
-
A scale factor to apply to the icon
-
The visibility of the icon itself, which allows you to control which feature is displayed
To help you build those expressions, the StyleExpressionFactoryStyleExpressionFactoryStyleExpressionFactory offers building blocks as well as various arithmetic and control flow operations to combine the building blocks in more complex
expressions.
Sample code/documentation to get you started
The article Parameterized feature styling offers a comprehensive overview of how to use parameterized styling and filtering. You can find an illustration of this feature in a dedicated sample titled "Parameterized Styling".

Connect to elevation data in the Luciad Tile Service (LTS) format
One of the service types offered by LuciadFusion for serving elevation data is LTS. This service type returns static maps, rendered as images, or elevation data. Elevation data in any of the formats supported by LuciadFusion can be converted into an LTS service. With this approach, you avoid having to access elevation data directly from the LuciadCPillar application. Instead, you stream the data from a remote location in a tiled and multi-leveled way.
LuciadCPillar now offers a connector to LTS services. You can access all information published inside the LTS capabilities, choose the desired coverages and visualize the resulting data on the map.
Sample code/documentation to get you started
The LuciadCPillar data formats documentation now includes a new page dedicated to the LTS format: Data Formats: LTS.
Other improvements
- Updated HERE Maps support
-
The HERE Maps Map Tile API v2 was deprecated by HERE. We updated the LuciadCPillar HERE Maps sample. It now illustrates the usage of the Raster Tile API v3.
- Creation of circles and arc bands
-
LuciadCPillar now offers utility classes for the interactive creation and editing of circles (by center point) and arc bands on the Map. To find out how to use those utility classes, see the tutorial Creating a custom geometry creator.
- Security upgrades
-
Several third-party libraries were upgraded. Detailed information can be found in the release notes.