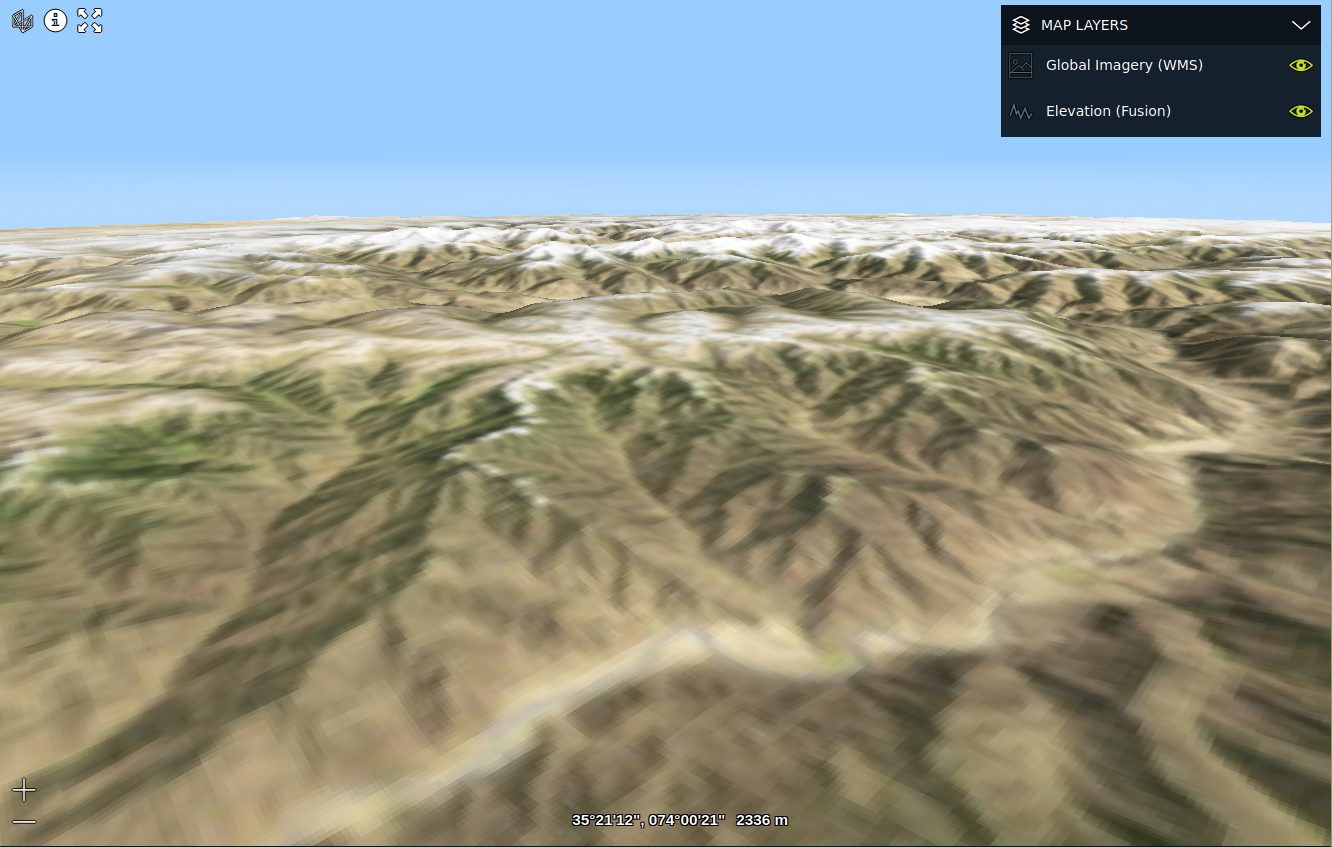
On a 3D RIAMap, you can load and visualize elevation data.
It’s visible as terrain. LuciadRIA drapes other raster data on that terrain.
|
Elevation data is visible on a 3D |
|
You can make only one elevation layer visible on a map. To add more than one elevation data source, you can combine those sources up front when you prepare your elevation coverage on the server. |
Using LuciadFusion elevation data
You can add elevation data from elevation coverage on a LuciadFusion Tile Service (LTS). Adding a model and layer for an elevation coverage is the same as adding a LuciadFusion image coverage:
-
Create a
FusionTileSetModelfor the coverage. -
Use a
RasterTileSetLayeras layer.
The Visualize LuciadFusion coverages tutorial shows you how you can do this.
Using elevation data from a custom data source
You can also connect to a custom non-LuciadFusion service that serves elevation data. The data on the service must meet some requirements, though:
- Data structure
-
The service must serve the elevation data as a multi-leveled dataset, with a quad-tree structure. No restrictions apply to the number of columns and rows at the first level of the dataset. Each subsequent level must have 4 times as many tiles as the preceding level, though. The levels should appear at a regular interval. That’s the case for a quad-tree dataset.
- Data format
-
The elevation tiles must be available in the TIFF format, as single-channel 32-bit IEEE floating point numbers, or as single-channel 16-bit signed integers. Each value in the TIFF file is interpreted as meters above the EGM96 geoid.
To create a custom elevation layer, create a RasterTileSetModel and set the dataType parameter to RasterDataType.ELEVATION.
Please refer to How to visualize GeoTIFF images for how to create such a model from a GeoTIFF image.