3D data, such as flight trajectories or extruded shapes, has a height dimension. Displaying it on a 3D map is straightforward.
You want to visualize 2D data, such as streets or administrative boundaries, right on top of the terrain though, even when that terrain changes.
To display shapes on the terrain, LuciadRIA uses a custom visualization technique called draping: the shape follows the changes in elevation, even when more detailed elevation data becomes available.
|
LuciadRIA also supports draping shapes on 3D Tiles with meshes. See the Draping on 3D Tiles article for more information. |
LuciadRIA uses the geometry and vertical reference of shapes to decide whether to drape them. If a geometry has an undefined or zero height (Z-coordinate), LuciadRIA drapes it.
You can override that default, and explicitly turn draping on or off through the drapeTarget parameter on ShapeStyle.
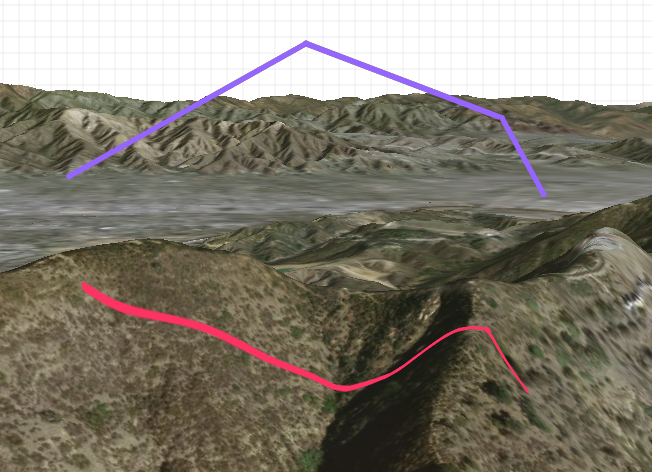
If you explicitly drape a 3D shape, its 2D shadow is painted on the terrain.
The drapeTarget parameter is relevant for 3D maps only. It’s ignored on 2D maps.
const painter = new FeaturePainter();

painter.paintBody = function(geocanvas, feature, shape, layer, map, paintState) {
  geocanvas.drawShape(shape, {
    fill: {
      color: "rgba(0,96,154,0.8)"
    },
    stroke: {
      color: "rgb(255,255,255)"
    },
    drapeTarget: DrapeTarget.TERRAIN // If you don't define this, it will automatically be determined based
                                // on the shape and its reference
  });
};