Adding a grid layer to the view
Grid layers do not contain actual data. Their main purpose is to provide a visual, usually uniform reference that makes it easier to locate data. LuciadLightspeed allows you to add such grid layers to your GXY view.
Choosing a predefined grid layer
LuciadLightspeed contains a number of grid layer implementations:
-
TLcdMapLonLatGridLayer: the most commonly used grid. The longitude-latitude grid is formed by evenly spaced meridians and parallels. It allows locating geographically referenced data immediately. -
TLcdMapLonLatGridLayerwithTLcdLonLatBorderGridPainter: a maritime-style grid that shows a border around the view with major and minor ticks. -
TLcdMapGeorefGridLayer: the World Geographic Reference System (GEOREF) divides the earth into 12 bands of latitude and 24 zones of longitude, each 15 degrees in extent. These areas are further divided into one degree units identified by 15 characters. -
TLcdXYGridLayer: a Cartesian (XY) grid. It is typically defined in the world reference of the view, which results in an axis-aligned grid.
The Defense Symbology component adds support for several military grids.
Using multi-level grids
The package com.luciad.view.map.multilevelgrid contains classes to define, render, and perform computations on a uniform, axis-aligned, multi-level grid. The grid depends
on the underlying reference system and enables to locate areas using multilevel coordinates.
An ILcdMultilevelGrid is defined by:
-
The location of its extreme points
-
The number of levels it consists of
-
The number of subdivisions per level and per axis
An area of an ILcdMultilevelGrid is designated by an ILcdMultilevelGridCoordinate.

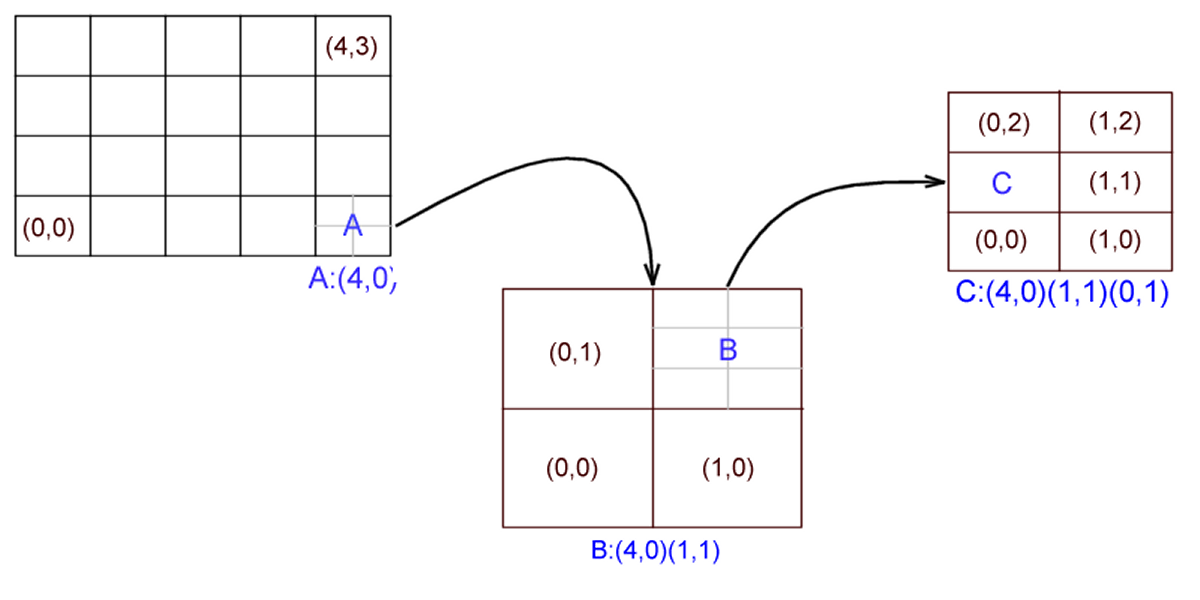
Figure 1, “Sample setup of a multilevel grid” demonstrates the setup of a multilevel grid which is defined by the following parameters:
-
The number of levels is 3
-
The subdivisions for level 0: 5 along the first axis, 4 along the second axis
-
The subdivisions for level 1: 2 along each axis
-
The subdivisions for level 2: 2 along the first axis, 3 along the second axis
You can derive the multilevel grid coordinates for the areas A, B, and C from the figure. Note that B denotes a smaller area
than A, as you can see from its more specific coordinates. Also from the coordinates, you can see that for example (4,0)(x,y)
lies inside (4,0), for any value of (x,y). TLcdMultilevelGridCoordinateModel is an ILcdModel implementation for ILcdMultilevelGridCoordinate objects that use this type of setup.
The sample code in the package samples.gxy.grid.multilevel.osgr contains an example of a multilevel grid: the British national grid.