1. Introduction
1.1. What is the COP demo?
The Common Operational Picture (COP) samples demonstrate how you can synchronize operation data between multiple clients connected to a server.
The samples consist of two components: a server component and client applications. The server is the application responsible for keeping multiple clients synchronized. The client applications are sample applications in the Lucy and LuciadRIA products.
The Common Operational Picture (COP) demo lets you experience the functional capabilities of these products in an operational environment. It allows you to:
-
Display a map with an Earth image, military symbology, airspaces and tracks
-
Create and monitor SPOT reports of events and conditions from locations on the map
-
Draw notes on the map
-
Search for gazetteer data
-
Synchronize data between clients via the server
|
The client applications in the products can all work together. They can all send and receive operational updates from the same server component. |
1.2. Contact information
If you have any questions after reading this guide, you can contact the Luciad Support Desk services by mailing to support.luciad.gsp@hexagon.com or dialing +32 (0)16 26 28 30.
2. Setting Up the COP server
2.1. Installing and running the demo
The COP server is included in the products Lucy and LuciadRIA . However, you only need to start one COP server, even if you want to run all products in the COP demo.
|
If you want to include LuciadRIA in the COP demo, start the COP server in the LuciadRIA product. This is necessary because LuciadRIA needs to run in a browser, and cannot easily connect to other servers. See Section 2.1.2, “Starting the COP server for LuciadRIA” to learn how to start the LuciadRIA COP server. |
2.1.1. Starting the COP server for Lucy
If you want to start the COP server for Lucy , first make sure that the Lucy installation has been completed. The following products and components need to be installed:
-
LuciadLightspeed and LuciadLightspeed license file
-
LuciadLightspeed Additional and Industry Specific Components:
-
OGC Web Server Suite (Ogc_server.zip)
-
Military Symbology (Military_symbology.zip)
-
After installing Lucy , start the COP server by executing the startCOPServer.sh script in the distrib/copservices folder of the Lucy distribution. If you are on Windows, execute the .bat script. On other platforms, start the .sh script. After a couple of seconds, the command prompt displays the message that the server has been set up successfully on
a specific port
The COP server also has a web interface that allows you to execute basic queries. You can access this web interface by opening
your browser, and navigating to http://localhost:8072.
2.1.2. Starting the COP server for LuciadRIA
If you want to start the COP server for Lucy as well , note that starting the LuciadRIA sample server will automatically start a COP server for all products.
First make sure that the LuciadRIA installation has been completed. The following products and components need to be installed:
-
LuciadLightspeed and LuciadLightspeed license file
-
Additional LuciadLightspeed and LuciadFusion components:
-
OGC Web Server Suite (Ogc_server.zip)
-
Military Symbology (Military_symbology.zip)
-
-
LuciadRIA and LuciadRIA license file
-
One of the web browsers from the list of browsers that support LuciadRIA
To start the LuciadRIA sample server, execute the startSampleServer script. This script is located in the LuciadRIA _x.x.x folder. If you are on Windows, execute the .bat script. On other platforms, execute the .sh script.
The LuciadRIA sample server allows you to run all its samples on http://localhost:8072/StartHere.html
3. The LuciadLightspeed COP client
You can start LuciadLightspeed’s Lucy COP sample by running the Lucy COP demo from the LuciadLightspeed launcher: double-click
start.jar, find the Lucy COP demo in the Start sample box, and click Run.
The COP demo consists of three themes:
-
Default: displays a raster image of the Earth, as well as major US cities
-
Air Picture: adds layers with tracks and airspace, and offers access to a gazetteer service
-
Mission Control: adds layers with map annotations, blue forces movement, and SPOT reports, and offers access to a gazetteer service
The COP demo starts up with the default theme. This theme displays a layer containing a raster image of the Earth, and a layer marking major USA cities.
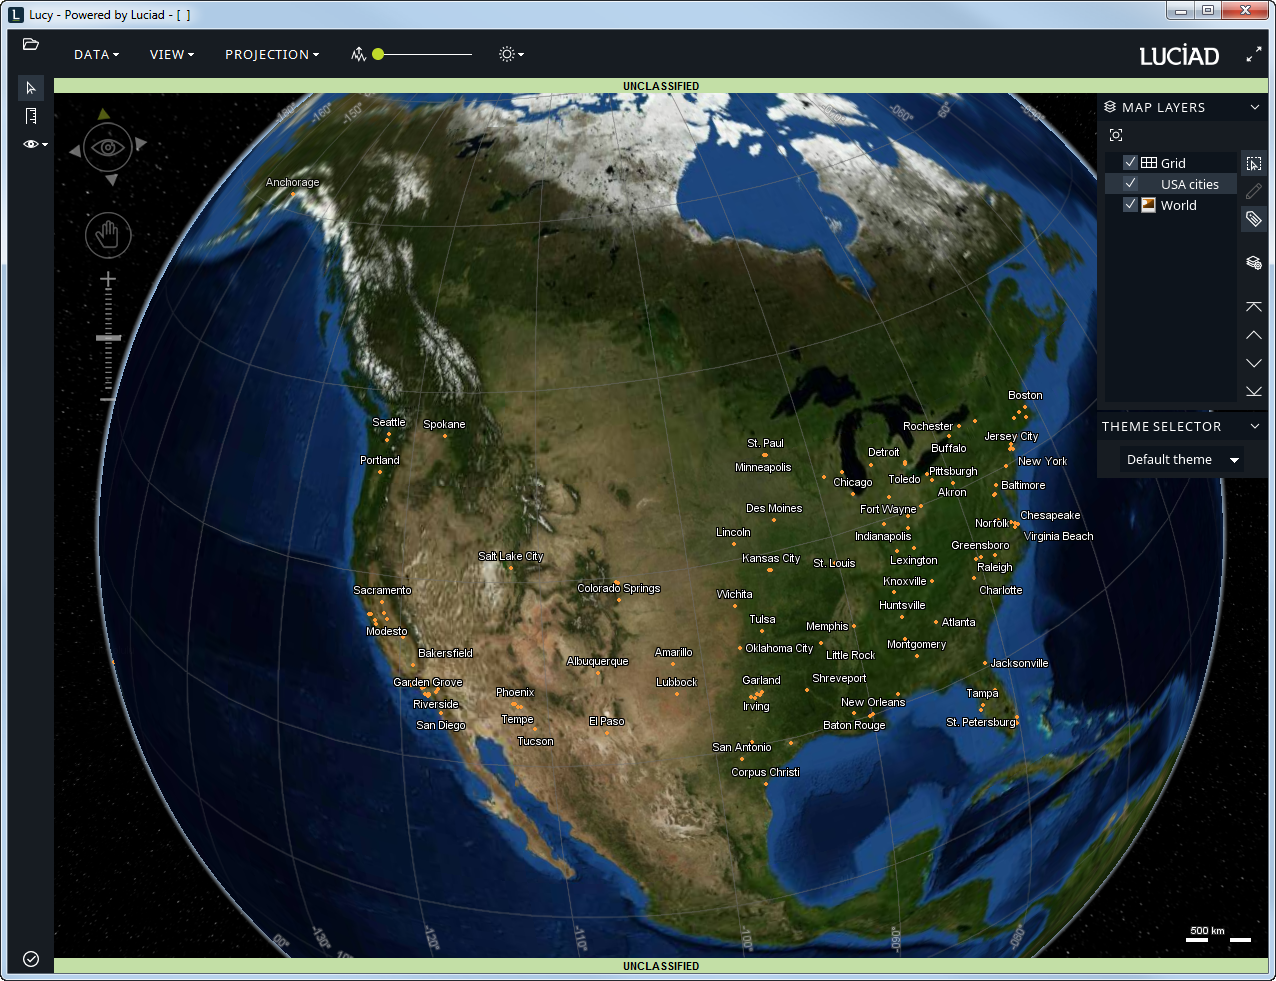
Use the drop-down menu in the Theme Selector pane on the control panel to select another theme with more layers.
This chapter first explains some general principles of working with the layers and objects in the COP demo. Next, it will go into the application functions that are specific to the available themes.
3.1. Managing layers
The COP demo lets you control which layers are displayed, as well as the properties of those layers. When you start up the demo, each theme will display all its available layers on the map.
3.1.1. Fitting a layer
To focus the map on the area displaying the contents of a particular layer, select the layer in the Layer pane, and press the Fit to layer button in the toolbar of the Layer pane.
3.1.2. Hiding a layer
To hide a layer from the map view, deselect the check box next to the layer in the Layer pane. To display the layer again, select the layer check box again.
3.1.3. Making layer objects selectable
To be able to select objects in a layer, and possibly edit them, select the layer in the Layer pane, and select the Toggle layer selectable button in the rightmost toolbar of the Layer pane.
3.1.4. Making layer objects editable
To be able to change the location of objects in a layer, select the layer in the Layer pane, and select the Toggle layer editable button in the rightmost toolbar of the Layer pane.
3.1.5. Showing and hiding object labels
Some objects display a label. For instance, the US cities in the default theme are labeled with the city name. To activate or deactivate the display of object labels in a certain layer, select that layer in the Layer pane, and select or deselect the Toggle layer labeled button in the rightmost toolbar of the Layer pane.
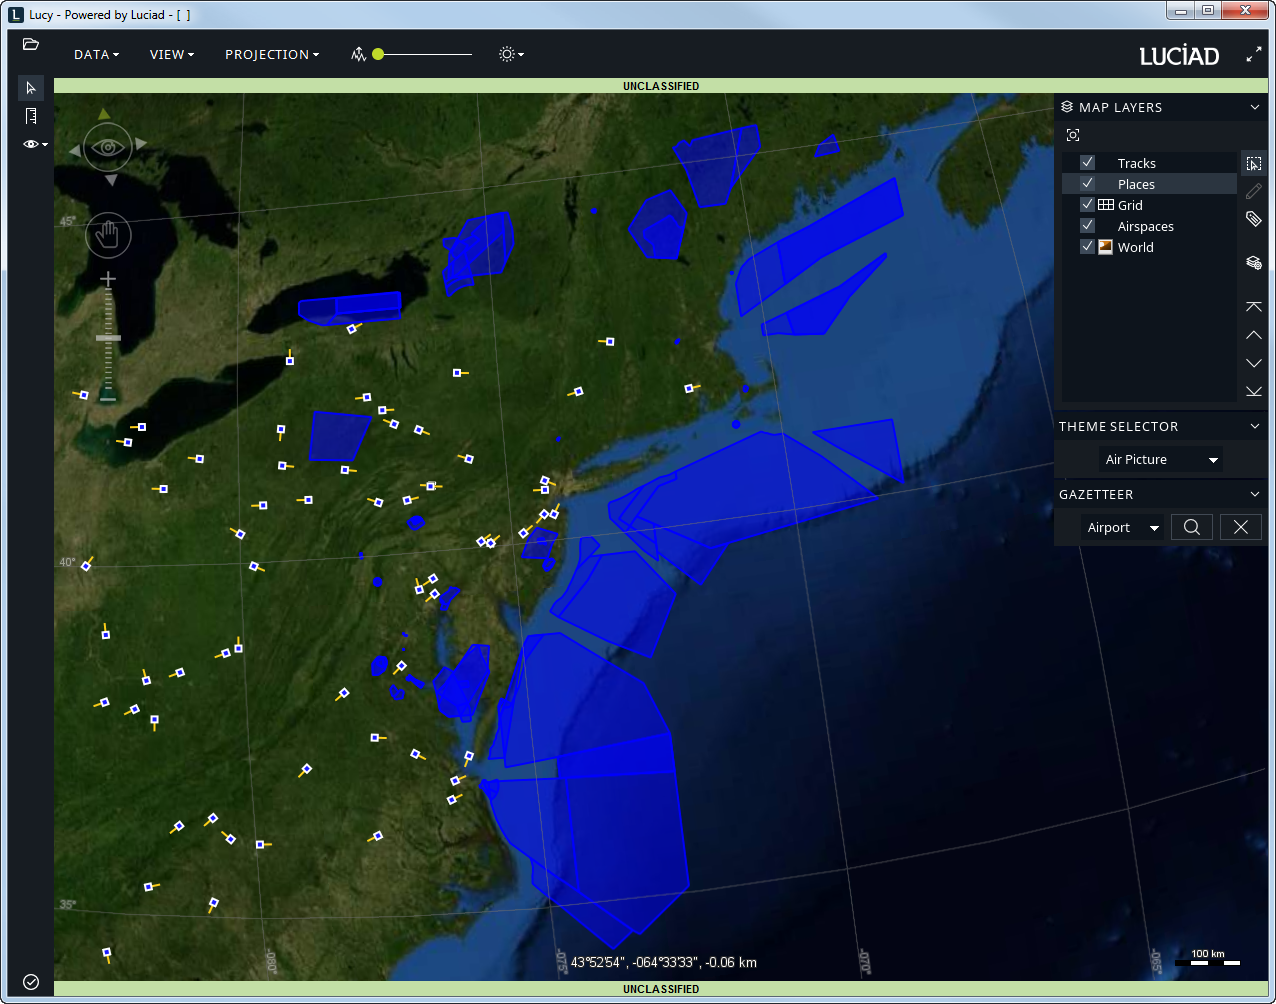
3.2. Air Picture
The Air Picture theme displays a collection of blue polygons that visualize air space areas over the Northeastern part of North America.
The Air Picture also includes tracks. A track visualizes the position and heading of an object, such as an airplane, at a certain point in time. You can see the tracks as blue square icons displayed over the USA. The aircraft’s heading is visualized as a line entering the blue square. If you select one of the track icons, the COP demo displays a border around the icon and the aircraft’s call sign.
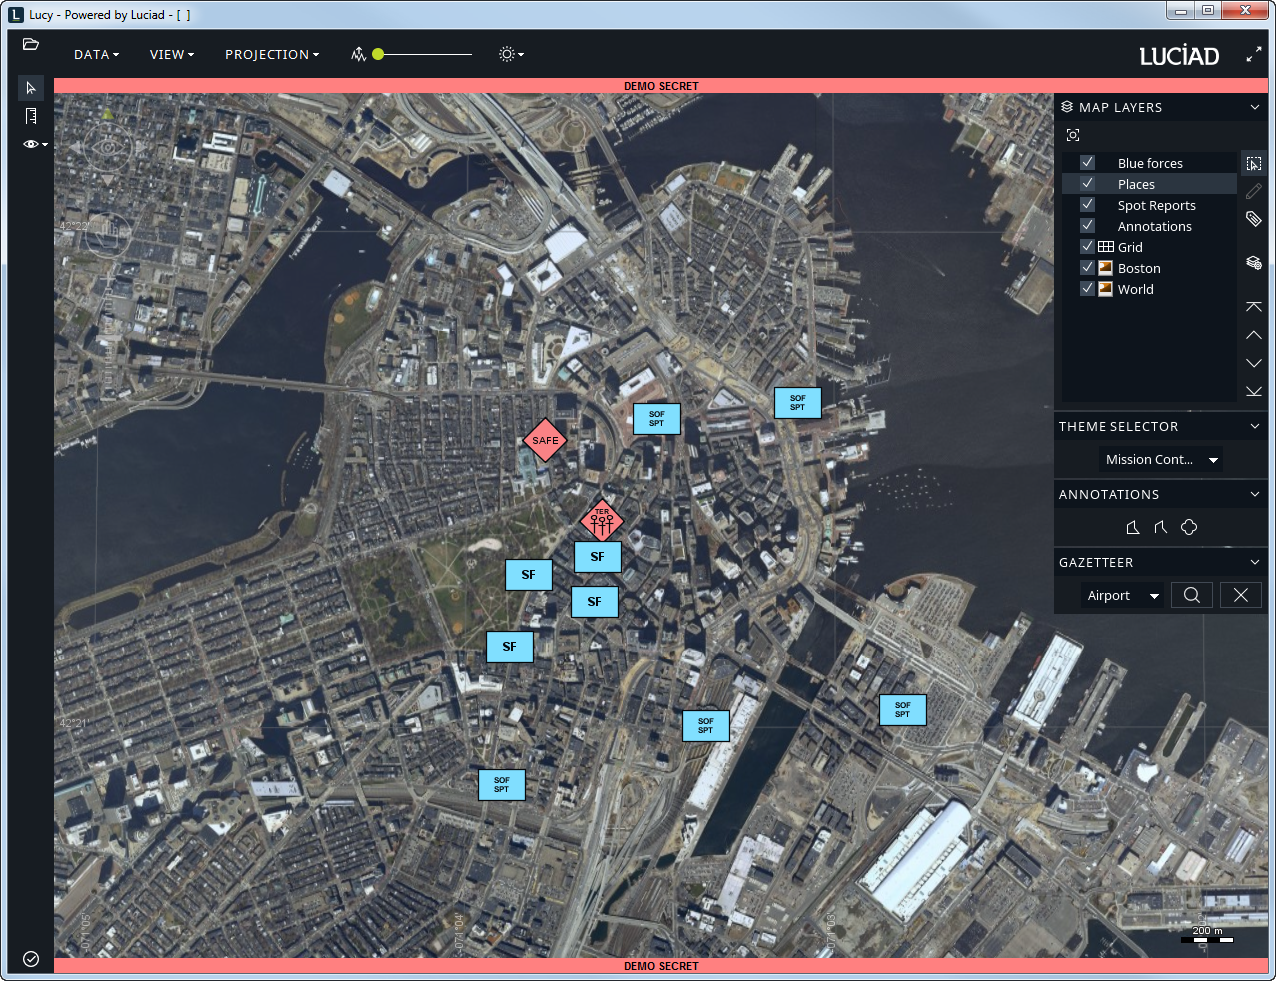
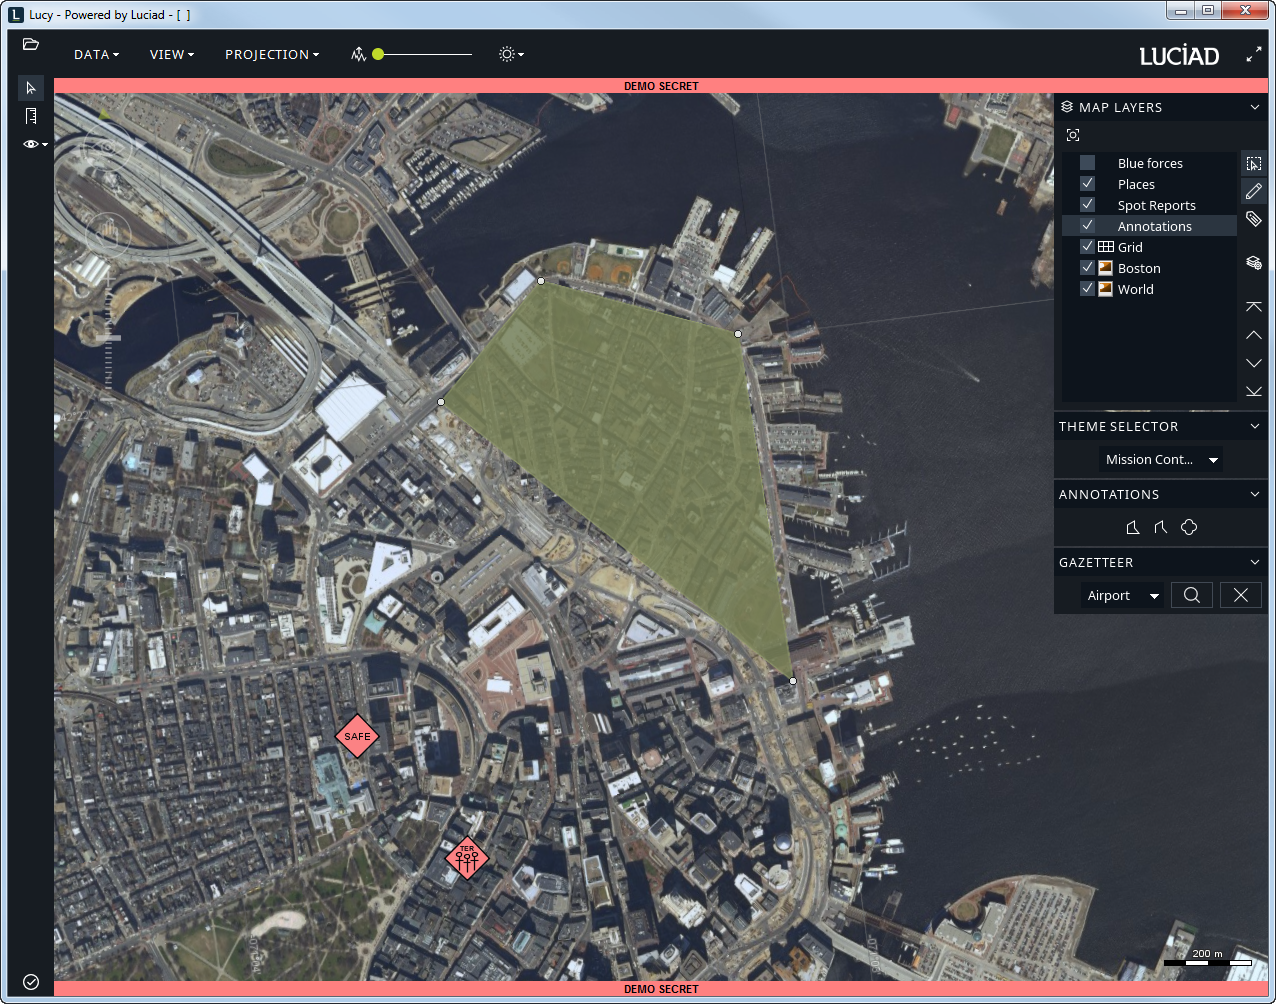
3.3. Mission control
The Mission Control theme allows you to visualize a military operation by displaying military symbology and annotations on the map. The depicted military operation involves the positioning and movement of the 'blue forces", a special operations forces team, and the location of enemy forces in the downtown Boston area. You can draw on the map, create reports for specific locations, and add more military symbols.
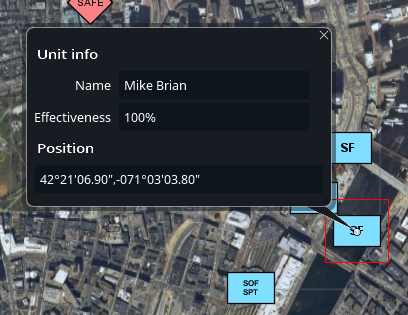
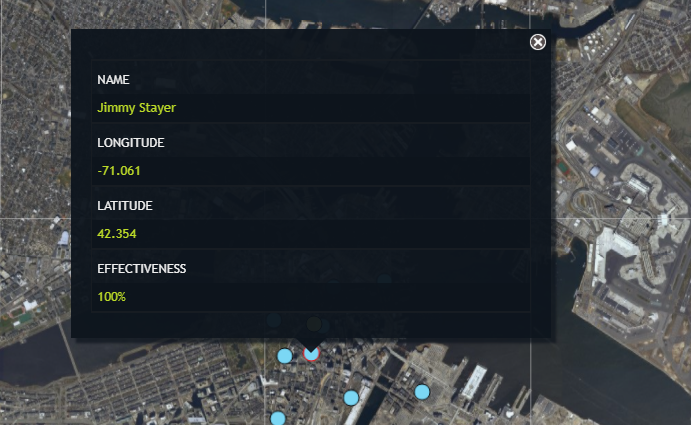
3.3.1. Learning more about the Blue forces units
To get more information about the Blue forces, make the layer selectable, and click one of the blue forces units. An information panel will inform you of the name, exact position and effectiveness of the unit.
3.3.2. Using SPOT reports
A SPOT report is a concise narrative report of essential information covering events or conditions that may have an immediate and significant effect on current planning and operations. In the COP demo, it is possible to create a SPOT report containing an image, a location and a date, classified by a military unit symbol.
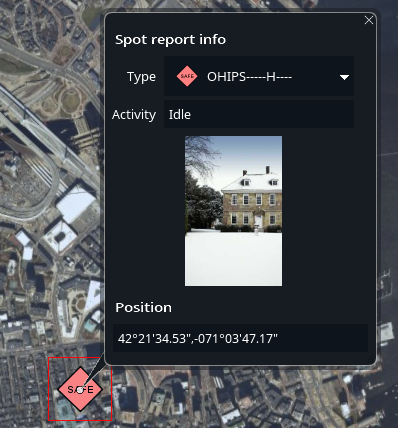
Viewing a SPOT report
To see the details of a SPOT report, select it on the map. An information panel will display information about the report, such as the military classification type, the coordinates at which the report was created, a description of the activity, and possibly an enclosed image.
Creating a SPOT report
-
In the Annotations pane on the Control panel, click the military symbol icon.
-
On the map, click the location where you want your report to show up. A military symbol appears at the clicked location.
-
To complete the report, click the military symbol. A panel pops up over the military symbol.
-
Select one of the military symbols in the drop-down menu.
-
If necessary, adjust the coordinates of the SPOT report location and press the Enter-key on you keyboard.
-
Enter an activity description in the Activity text box and press the Enter-key on you keyboard.
|
If you are creating your SPOT report on a mobile device, you can use the device camera application to add an image to your SPOT report. |
Editing a SPOT Report
To change information in a SPOT report:
-
If necessary, make the
Spot reportslayer selectable. -
Click the military symbol linked to the report on the map. A panel pops up over the military symbol.
-
You can select a different military symbol or code for the report, the location of the report, or the activity description.
-
When you are done editing your report, press the Enter-key on you keyboard.
3.3.3. Adding annotations to the map
The COP demo allows you to annotate the map manually by drawing polygons or lines.
Creating an annotation
To draw a shape on your map:
-
Click either the polygon or the arrow icon in the Annotations pane of the Control panel.
-
Draw your shape on the map by clicking several points on the map. The COP demo will connect the points to form a polygon or line. Alternatively, you can draw a line by clicking the mouse and dragging the cursor over the screen.
-
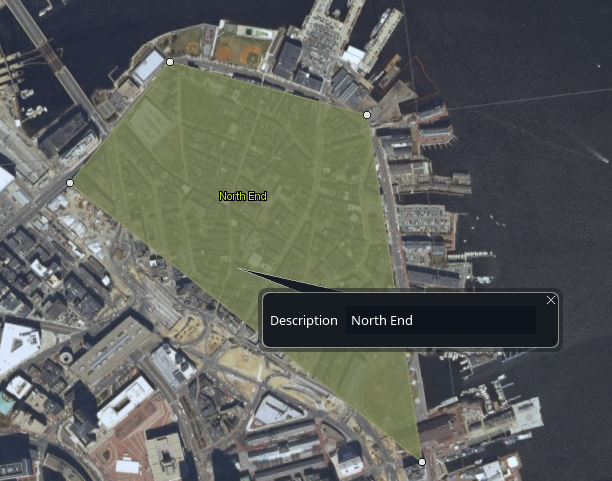
When you have finished drawing your shape, perform a double-click, or deselect the annotation icon in the Annotation pane on the Control panel. A label pops up over the shape when you finish drawing. In the Description label, add the text that goes with the shape, and press ENTER. The annotation text is displayed on the shape. Whenever you select the shape later on, the annotation is displayed again..
|
The third icon in the Annotations pane allows you to create SPOT reports. For more information, see Section 3.3.2, “Using SPOT reports”. |
Editing an annotation
Before you edit an annotation, make sure that you have made the Annotations layer editable, as described in Section 3.1, “Managing layers”.
You can add a description to the annotation, or edit the annotation shape. Click the annotation to let an editable label pop up over the annotation.
Adding a description
To add a description for the annotation, fill in the text box, and close the label.
Editing the annotation shape
To edit the shape of the annotation, drag any of the points of the line or polygon to a new location. You can also drag the entire line or polygon to a new location.
To add a point to the annotation shape, press the Ctrl-key and click a location at the edge of the shape with the mouse. The cursor shape changes to indicate that you can add a point.
To remove a point from the annotation shape, press the Ctrl-key and click the point you want to delete.
3.4. Displaying gazetteer data
The gazetteer service is available in the Air Picture theme and the Mission Control theme. It is possible to search for and display gazetteer data via the search box in the Gazetteer pane. The search results are displayed on the map with symbols. To see the name of a facility, select the symbol.
When you perform a search, the COP demo will limit the returned data to cover the visual area displayed on the screen, to reduce the volume of loaded data.
|
A search performed while you have zoomed in to a very small area of the map may not yield any results at all. If you perform a search while the whole world map is visible, the COP demo may only show a part of the returned search results. |
3.4.1. Searching for gazetteer information
To search for information:
-
Zoom in on the map area you are interested in.
-
Go to the Gazetteer pane in the control panel, and select either
Airport,Hospital, orSchoolsfrom the drop-down menu. -
Click the Magnifying glass icon next to the drop-down menu. The COP demo will place icons on the map to display the results available for the geographic area visible in your view.
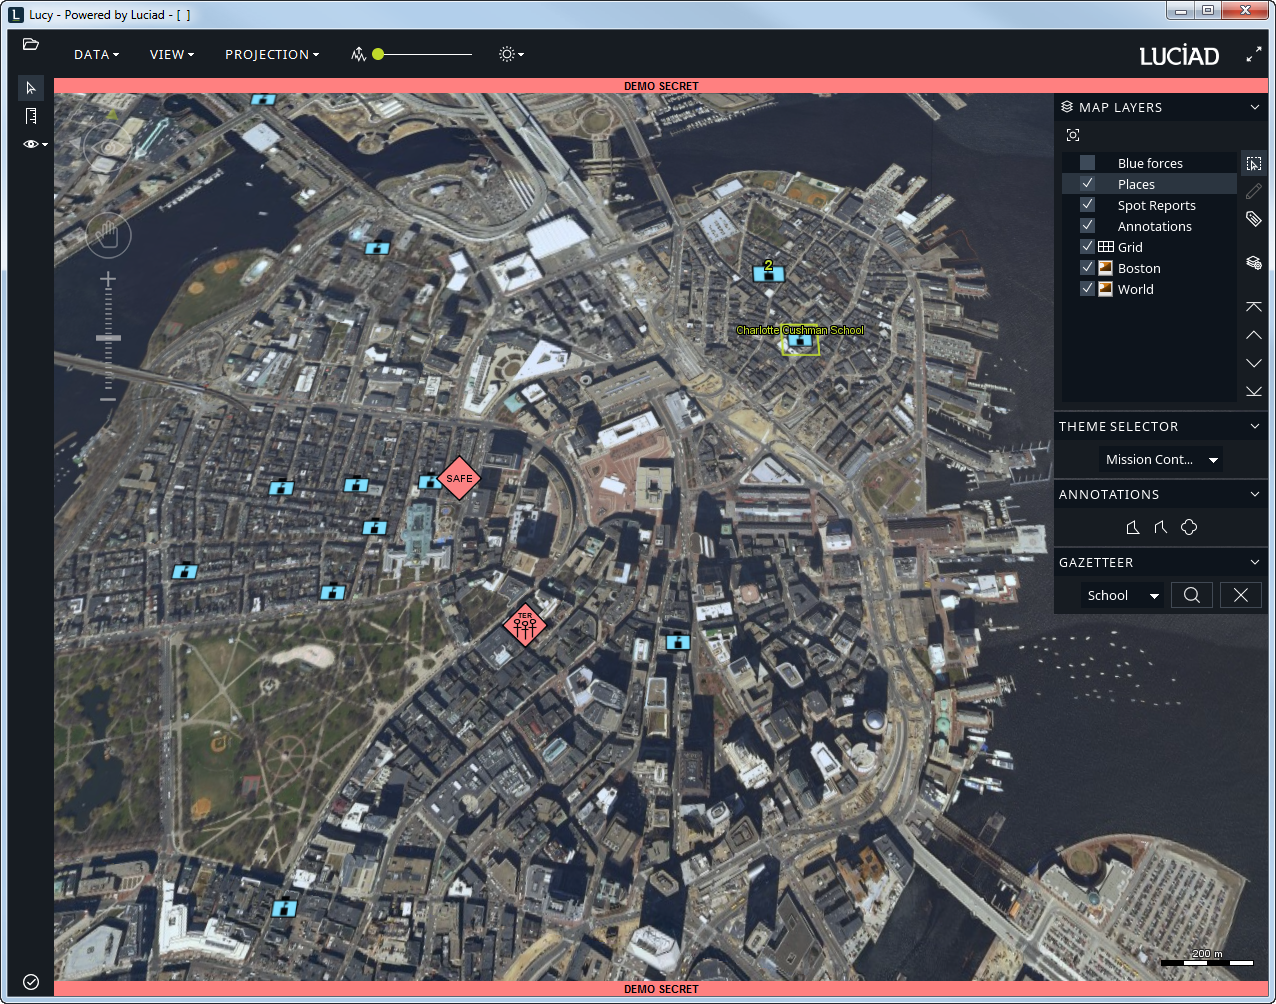
Once you have performed a gazetteer search, the COP demo also adds a Places layer to the list of layers in the Layer pane. To hide the gazetteer search results on the map, deselect the Places layer.
To see the name of a place returned by a gazetteer search, click it on the map. The place name will be displayed as a label.
3.4.2. Clearing a search
To clear the icons displayed after an earlier search, click the cross icon next to the gazetteer dropdown menu in the Control panel.
3.4.3. Clustering objects
When there are many objects in a view, it becomes difficult to keep the overview. Therefore, the COP demo makes use of clustering to help reduce the clutter. A clustering algorithm automatically clusters objects that are close together. Zoom out of the map to see the clustering taking place. When you zoom in again, the clustered objects are unclustered again.
The cluster icon size depends on the number of cluster elements. That number is also added to the cluster as a label.
|
For an in-depth explanation of clustering see the chapter Clustering in the LuciadLightspeed developer’s guide. |
4. The LuciadRIA COP client
You can start the LuciadRIA client by opening the following URL in a supported browser: http://localhost:8072/web/samples/cop
The COP demo consists of three themes:
-
Default: displays a raster image of the Earth, as well as major US cities
-
Air Picture: adds layers with tracks and airspaces, and offers access to a gazetteer service
-
Mission Control: adds layers with map annotations, blue forces movement, and SPOT reports, and offers access to a gazetteer service
The COP demo starts up with the default theme. This theme displays a layer containing an Earth image loaded from the WMS server, and a layer marking major USA cities.
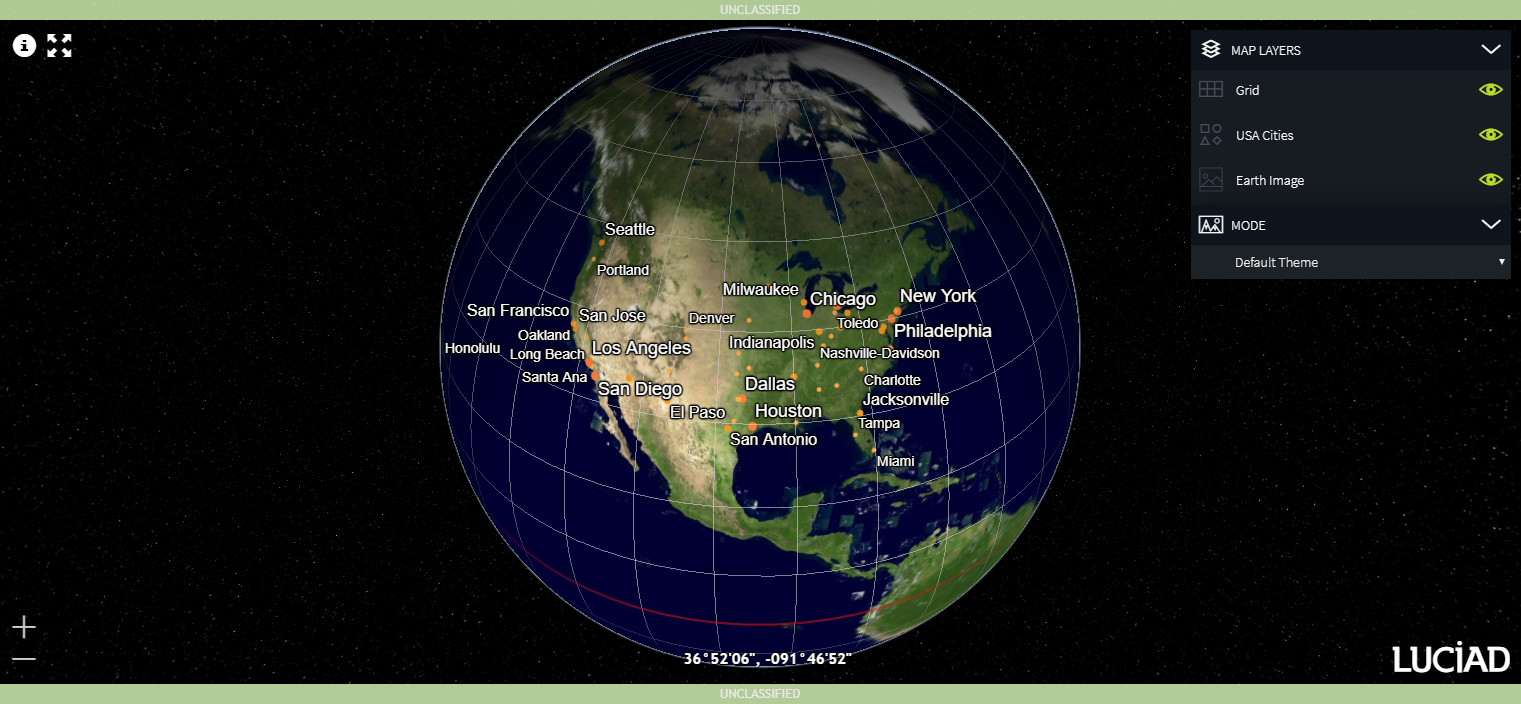
Use the drop-down menu in the Mode pane on the control panel to select another theme with more layers.
This chapter first explains some general principles of working with the layers and objects in the COP demo. Next, it will go into the application functions that are specific to the available themes.
4.1. Managing layers
The COP demo lets you control which layers are displayed, as well as the properties of those layers. When you start up the demo, each theme will display all its available layers on the map.
4.1.1. Fitting a layer
To focus the map on the area displaying the contents of a particular layer, hover over the layer in the Map layers pane, and select the Fit to data option from the context menu.
4.1.2. Hiding a layer
To remove a layer from the map view, deselect the eye icon next to the layer in the Map layers pane. To display the layer again, select the eye icon again.
4.1.3. Making layer objects selectable
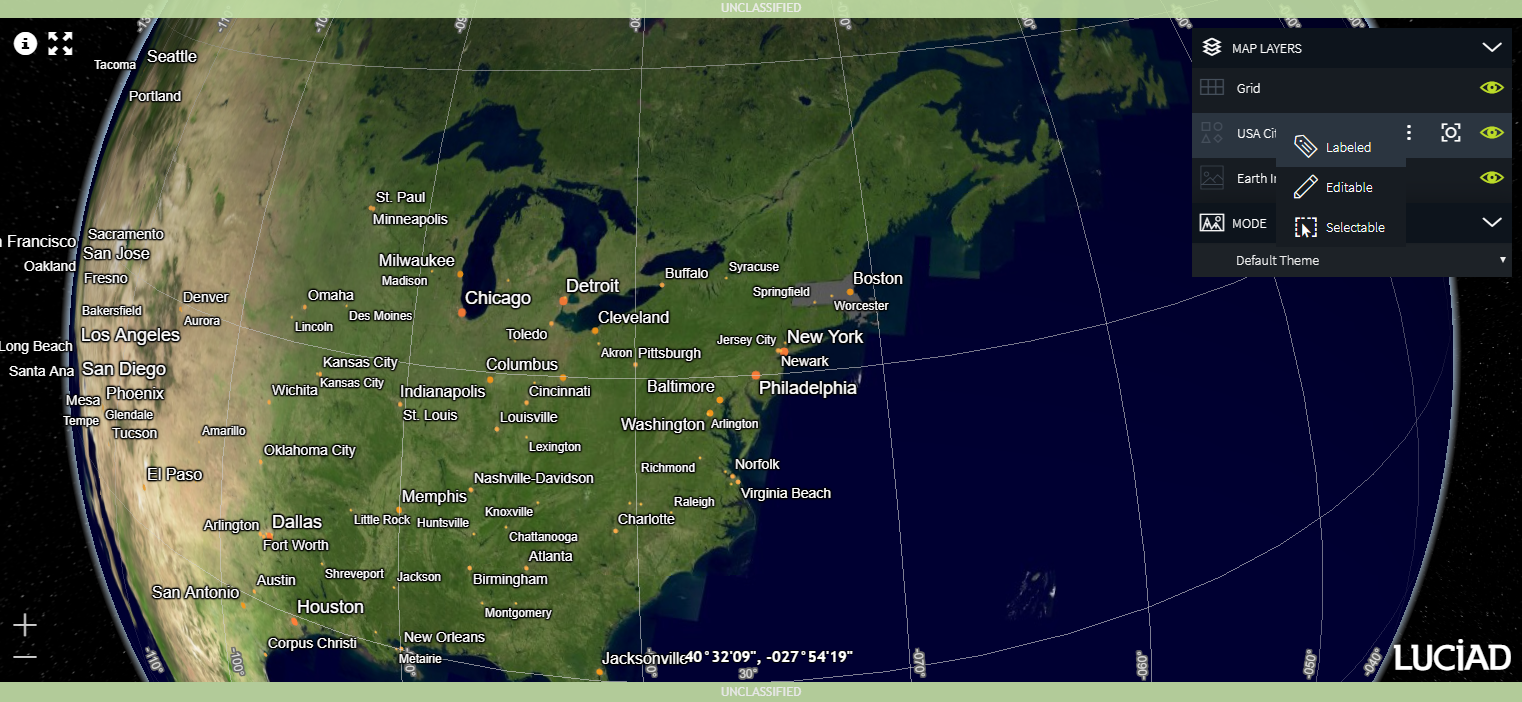
To be able to select objects in a layer, and possibly edit them, right-click the layer in the Map layers pane, and select the Selectable option from the context menu.
4.1.4. Showing and hiding object labels
Some objects display a label. For instance, the US cities in the default theme are labeled with the city name. To activate or deactivate the display of object labels in a certain layer, right-click that layer in the Map layers pane, and select or deselect the Labeled option from the context menu.
4.2. Air Picture
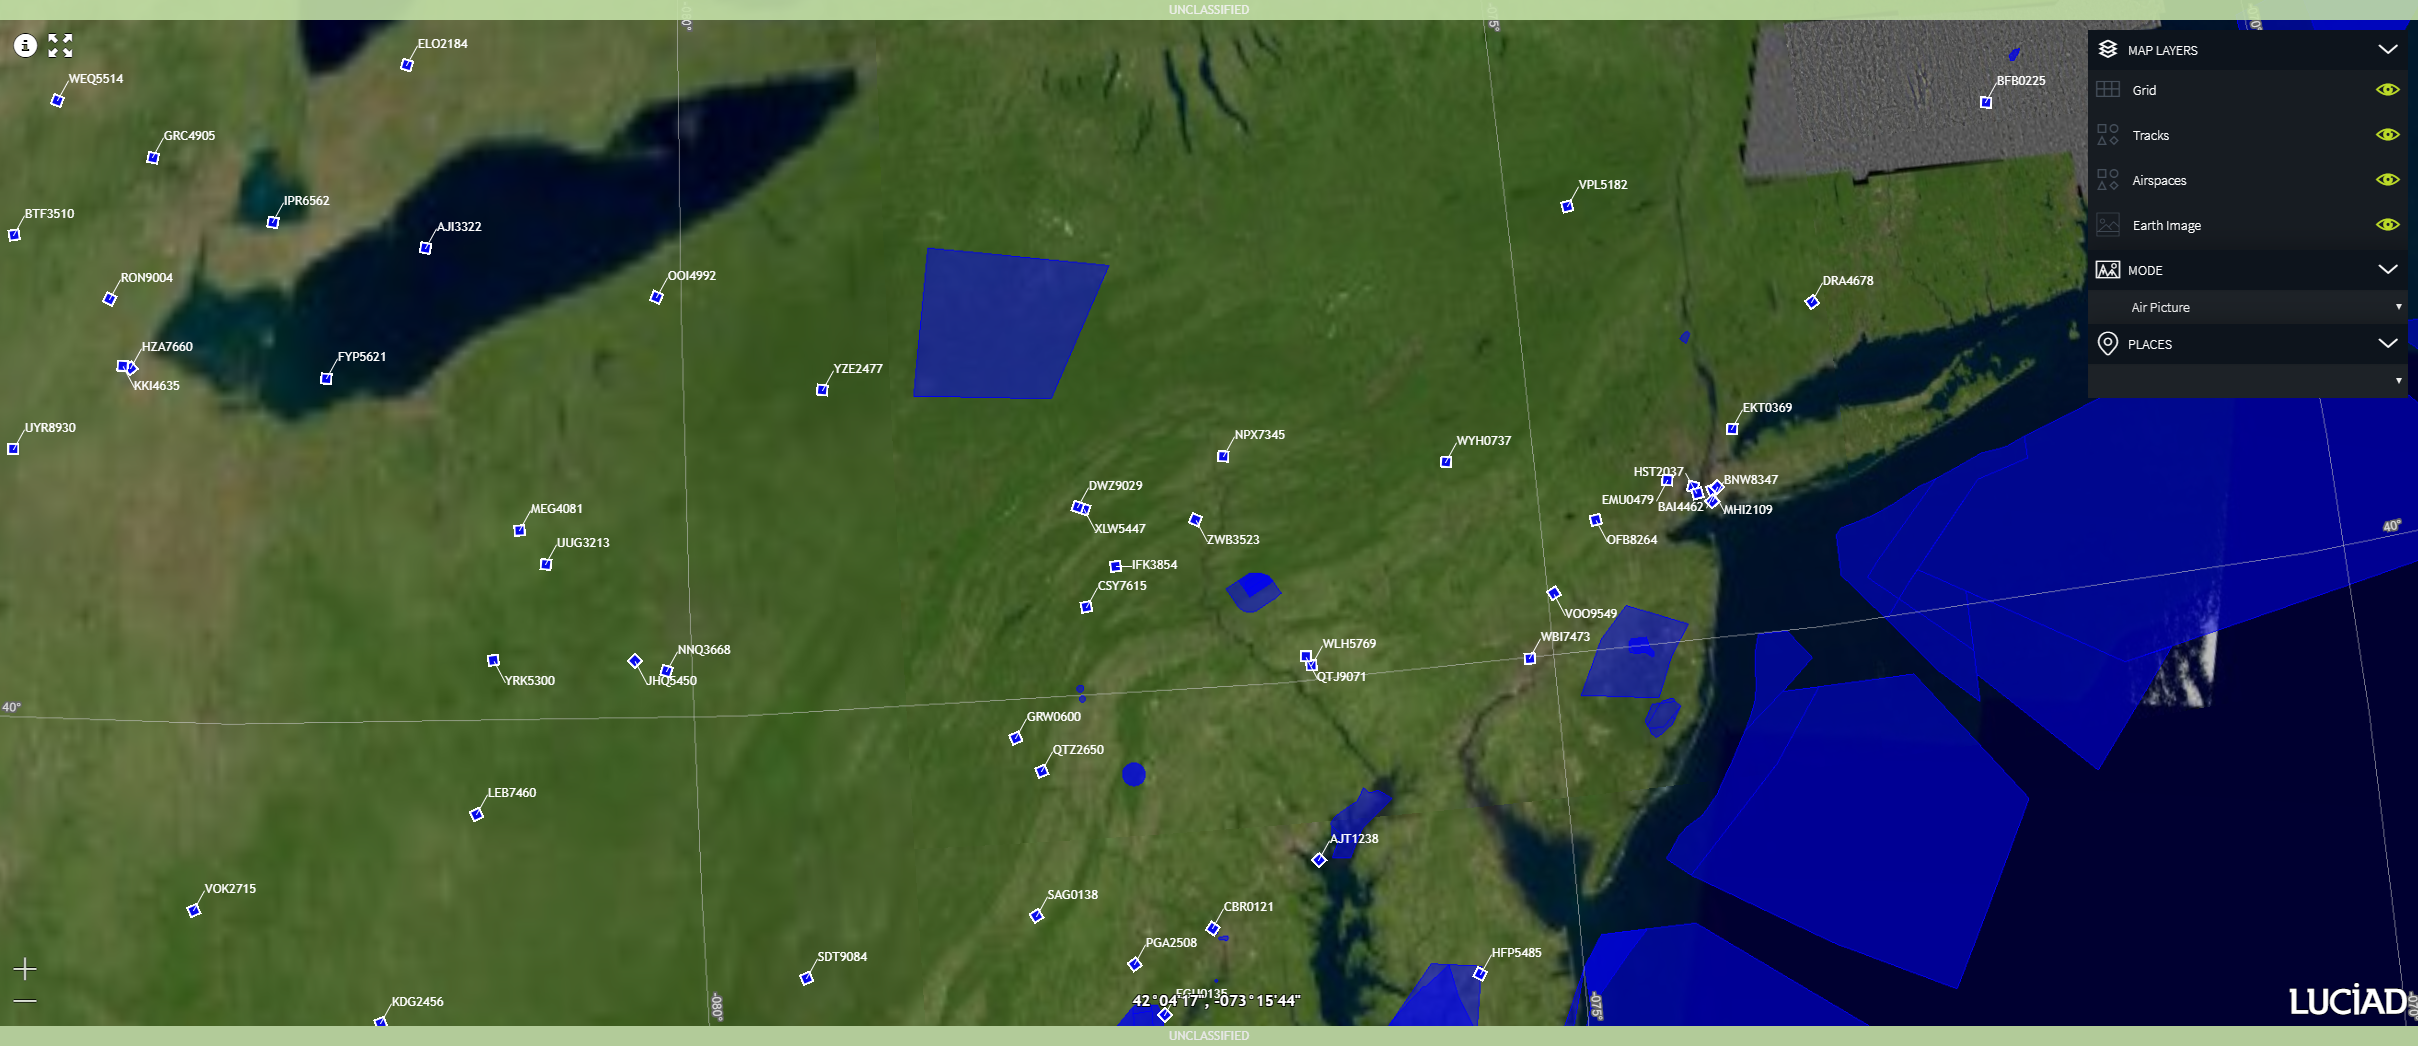
The Air Picture theme displays a collection of blue polygons that visualize air space areas over the Northeastern part of North America.
The Air Picture also includes tracks. A track visualizes the position and heading of an object, such as an airplane, at a certain point in time. You can see the tracks as blue square icons displayed over the USA. If you select one of the track icons, the COP demo changes the icon’s border color, and displays the aircraft’s call sign and heading.
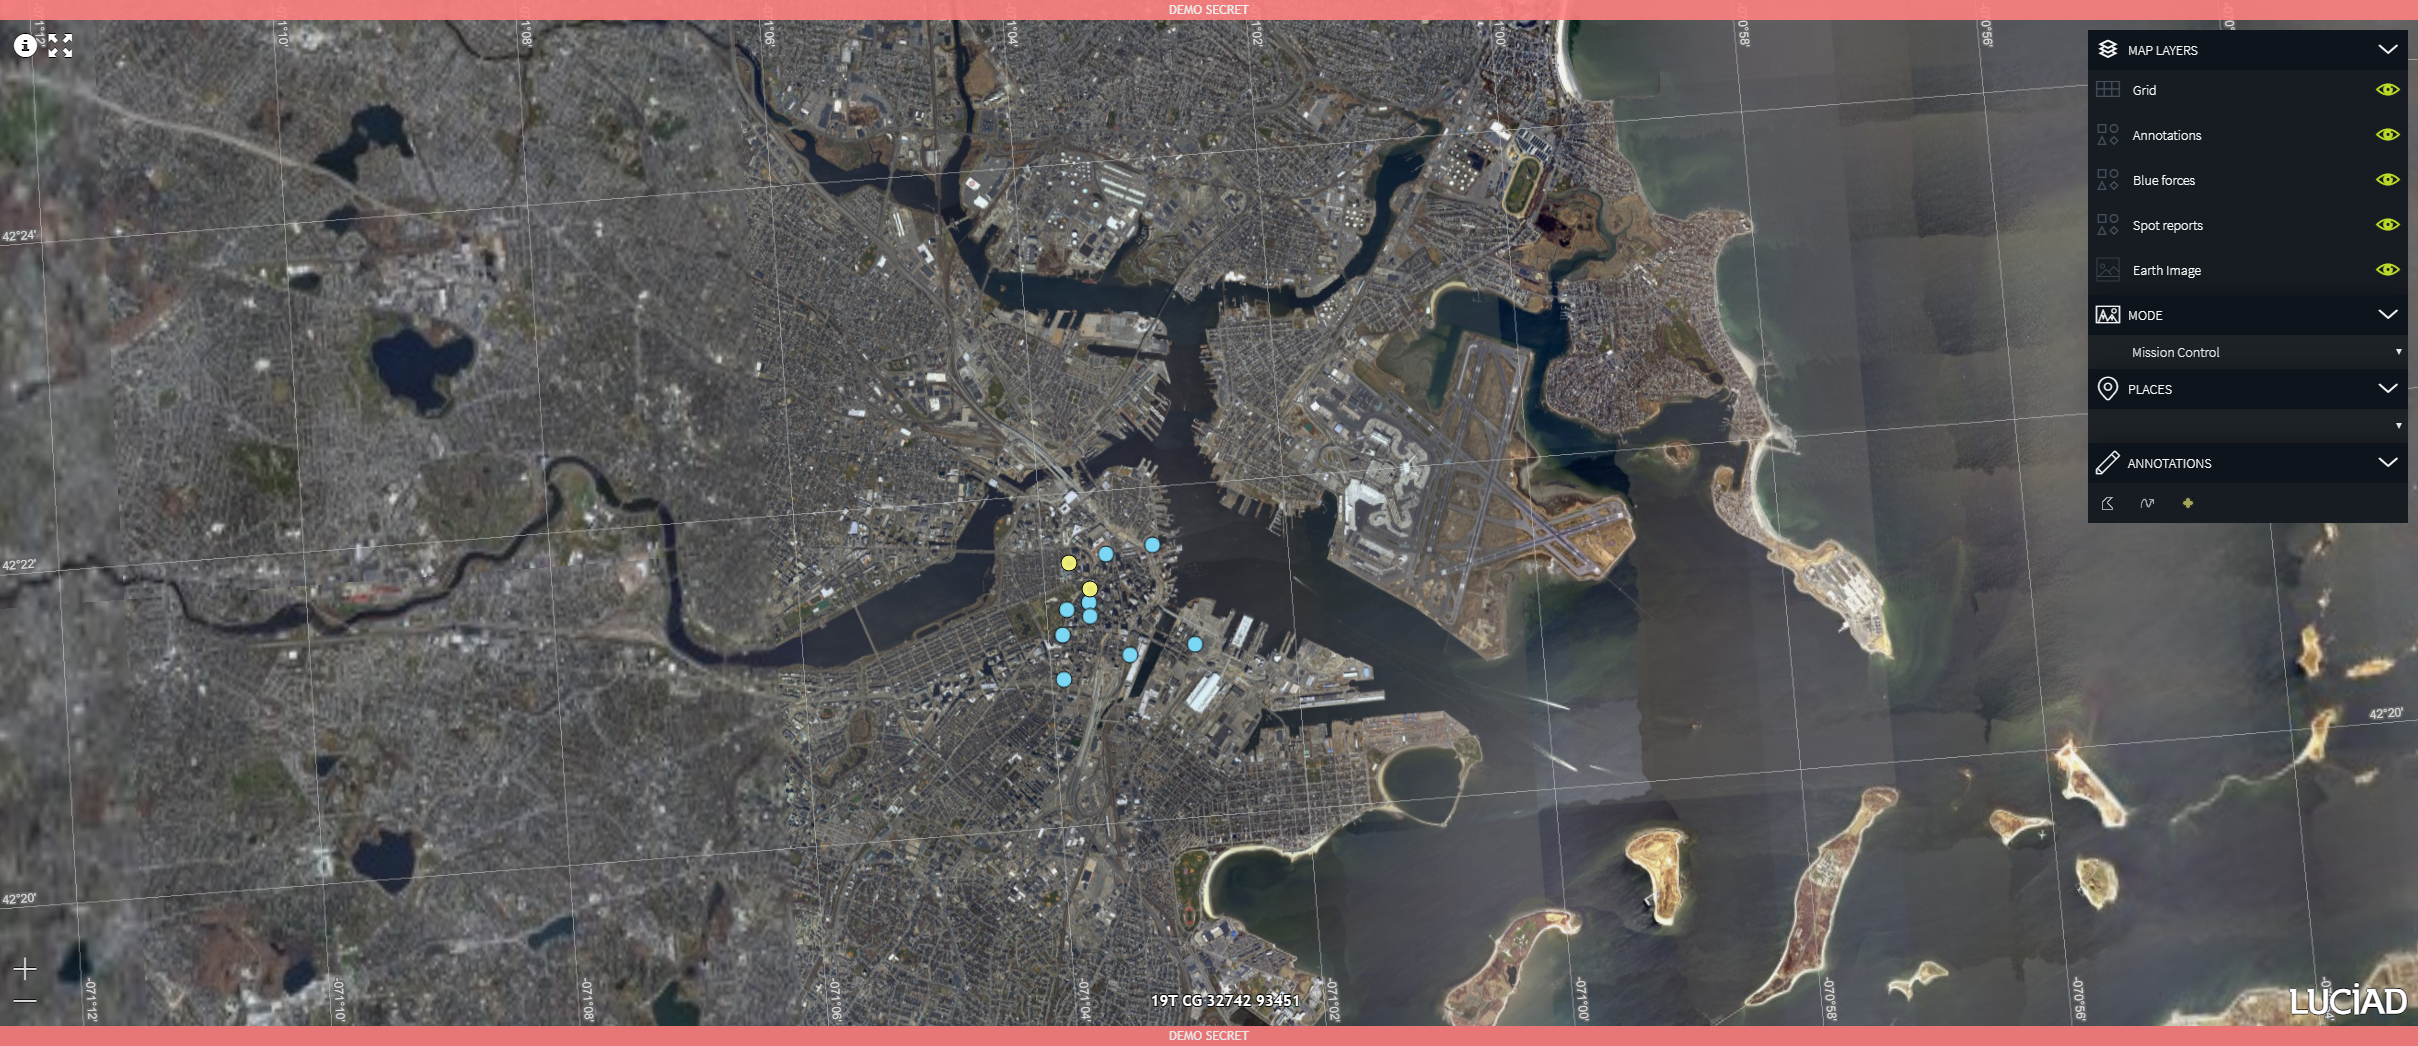
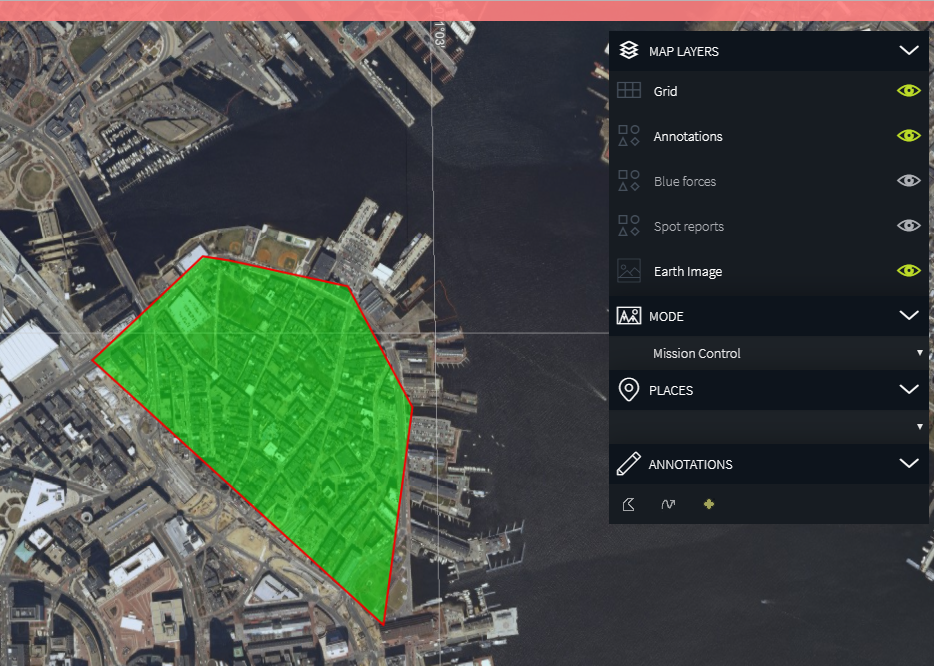
4.3. Mission control
The Mission Control theme allows you to visualize a military operation by displaying military symbology and annotations on the map. The depicted military operation involves the positioning and movement of the 'blue forces", a special operations forces team, and the location of enemy forces in the downtown Boston area. You can draw on the map, create reports for specific locations, and add more military symbols.
|
If the optional LuciadRIA Military Symbology component is installed, the COP demo uses symbols of the MS2525c military symbology standard to visualize the SPOT Reports and the Blue Forces. In addition, you can edit all available properties and modifiers of a SPOT Report in the balloon’s editing form. If the LuciadRIA Military Symbology component is not included, the COP demo uses a simplified representation of the military symbols, and it is not possible to edit all SPOT report properties. All screenshots in this guide are taken from a COP demo version that includes the Military Symbology component. |
4.3.1. Learning more about the Blue forces units
To get more information about the Blue forces, make the layer selectable, and click one of the blue forces units. An information panel will inform you of the name, exact position and effectiveness of the unit.
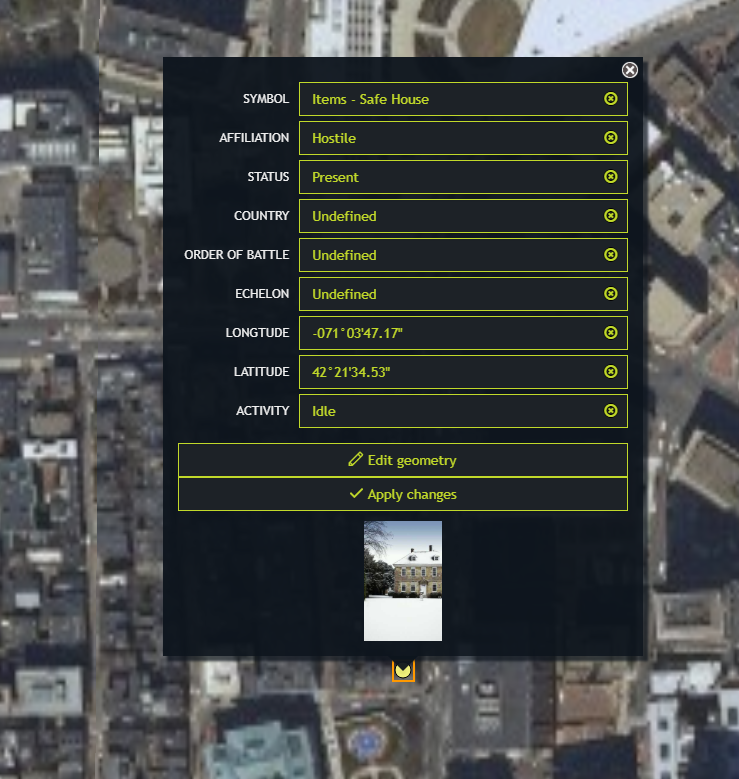
4.3.2. Using SPOT reports
A SPOT report is a concise narrative report of essential information covering events or conditions that may have an immediate and significant effect on current planning and operations. In the COP demo, it is possible to create a SPOT report containing an image, a location and a date, classified by a military unit symbol.
Viewing a SPOT report
To see the details of a SPOT report, select it on the map. An information panel will display information about the report, such as the military classification type, the coordinates at which the report was created, a description of the activity, and possibly an enclosed image. Click the image to display a larger version of the image.
Creating a SPOT report
-
In the Annotations pane on the Control panel, click the military symbol icon.
-
On the map, click the location where you want your report to show up. The "Unknown" military symbol appears at the clicked location.
-
To complete the report, click the military symbol. A panel pops up over the military symbol.
-
Select one of the military symbols in the Symbol drop-down menu.
-
If necessary, adjust the information about the SPOT report, or the coordinates of the SPOT report location.
-
Enter an activity description in the Activity text box.
-
Click the Update button to store your report and update the map symbol.
|
If you are creating your SPOT report on a mobile device, you can use the device camera application to add an image to your SPOT report. |
Editing a SPOT Report
To change information in a SPOT report:
-
If necessary, make the
Spot reportslayer selectable. -
Click the military symbol linked to the report on the map. A panel pops up over the military symbol.
-
You can select a different military symbol or code for the report, the location of the report, or the activity description.
-
When you are done editing your report, click the Update button in the report panel. Your edits are saved in the report.
4.3.3. Adding annotations to the map
The COP demo allows you to annotate the map manually by drawing polygons or lines.
Creating an annotation
To draw a shape on your map:
-
Click either the polygon or the arrow icon in the Annotations pane of the Control panel.
-
Draw your shape on the map by clicking several points on the map. The COP demo will connect the points to form a polygon or line. Alternatively, you can draw a line by clicking the mouse and dragging the cursor over the screen.
-
When you have finished drawing your shape, perform a double-click, or deselect the annotation icon in the Annotation pane on the Control panel. The COP demo no longer interprets the movements on the screen as drawing activity.
To add text to the annotation, click the annotation after you finished drawing it, and add the text in the label that pops up. When you have completed the text, press ENTER, and click outside the label to store the text.
|
The third icon in the Annotations pane allows you to create SPOT reports. For more information, see Section 4.3.2, “Using SPOT reports”. |
Editing an annotation
Before you edit an annotation, make sure that you have made the Annotations layer selectable.
You can add a description to the annotation, or edit the annotation shape. Click the annotation to let an editable label pop up over the annotation.
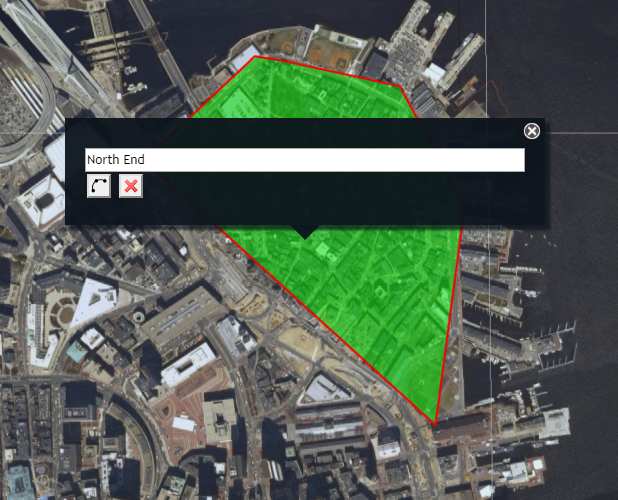
Adding a description
To add a description for the annotation, fill in the text box, and press ENTER.
Editing the annotation shape
To edit the shape of the annotation, click the polyline button on the label. The label disappears, and the COP demo now allows you to:
-
Change the shape by dragging any of the points of the line or polygon to a new location
-
Add new points to the shape by clicking and manipulating the control points located in between the shape points.
-
Delete a shape point by clicking and holding the point you want to delete, or by pressing the Ctrl-key and selecting the point of the shape with the mouse.
When you want to stop editing the annotation shape, double-click anywhere on the map to leave the shape editing mode.
4.4. Displaying gazetteer data
The gazetteer service is available in the Air Picture theme and the Mission Control theme. It is possible to display gazetteer data via the Places pane. The search results are displayed on the map with symbols. To see the name of a facility, select the symbol.
When you perform a search, the COP demo will limit the returned data to cover the visual area displayed on the screen, to reduce the volume of loaded data.
|
A search performed while you have zoomed in to a very small area of the map may not yield any results at all. If you perform a search while the whole world map is visible, the COP demo may only show a part of the returned search results. |
4.4.1. Searching for gazetteer information
To search for information:
-
Zoom in on the map area you are interested in.
-
Go to the Places pane in the control panel, and select either
Airport,Hospital, orSchoolsfrom the drop-down menu. -
Click the Magnifying glass icon next to the drop-down menu. The COP demo will place icons on the map to display the results available for the geographic area visible in your view.
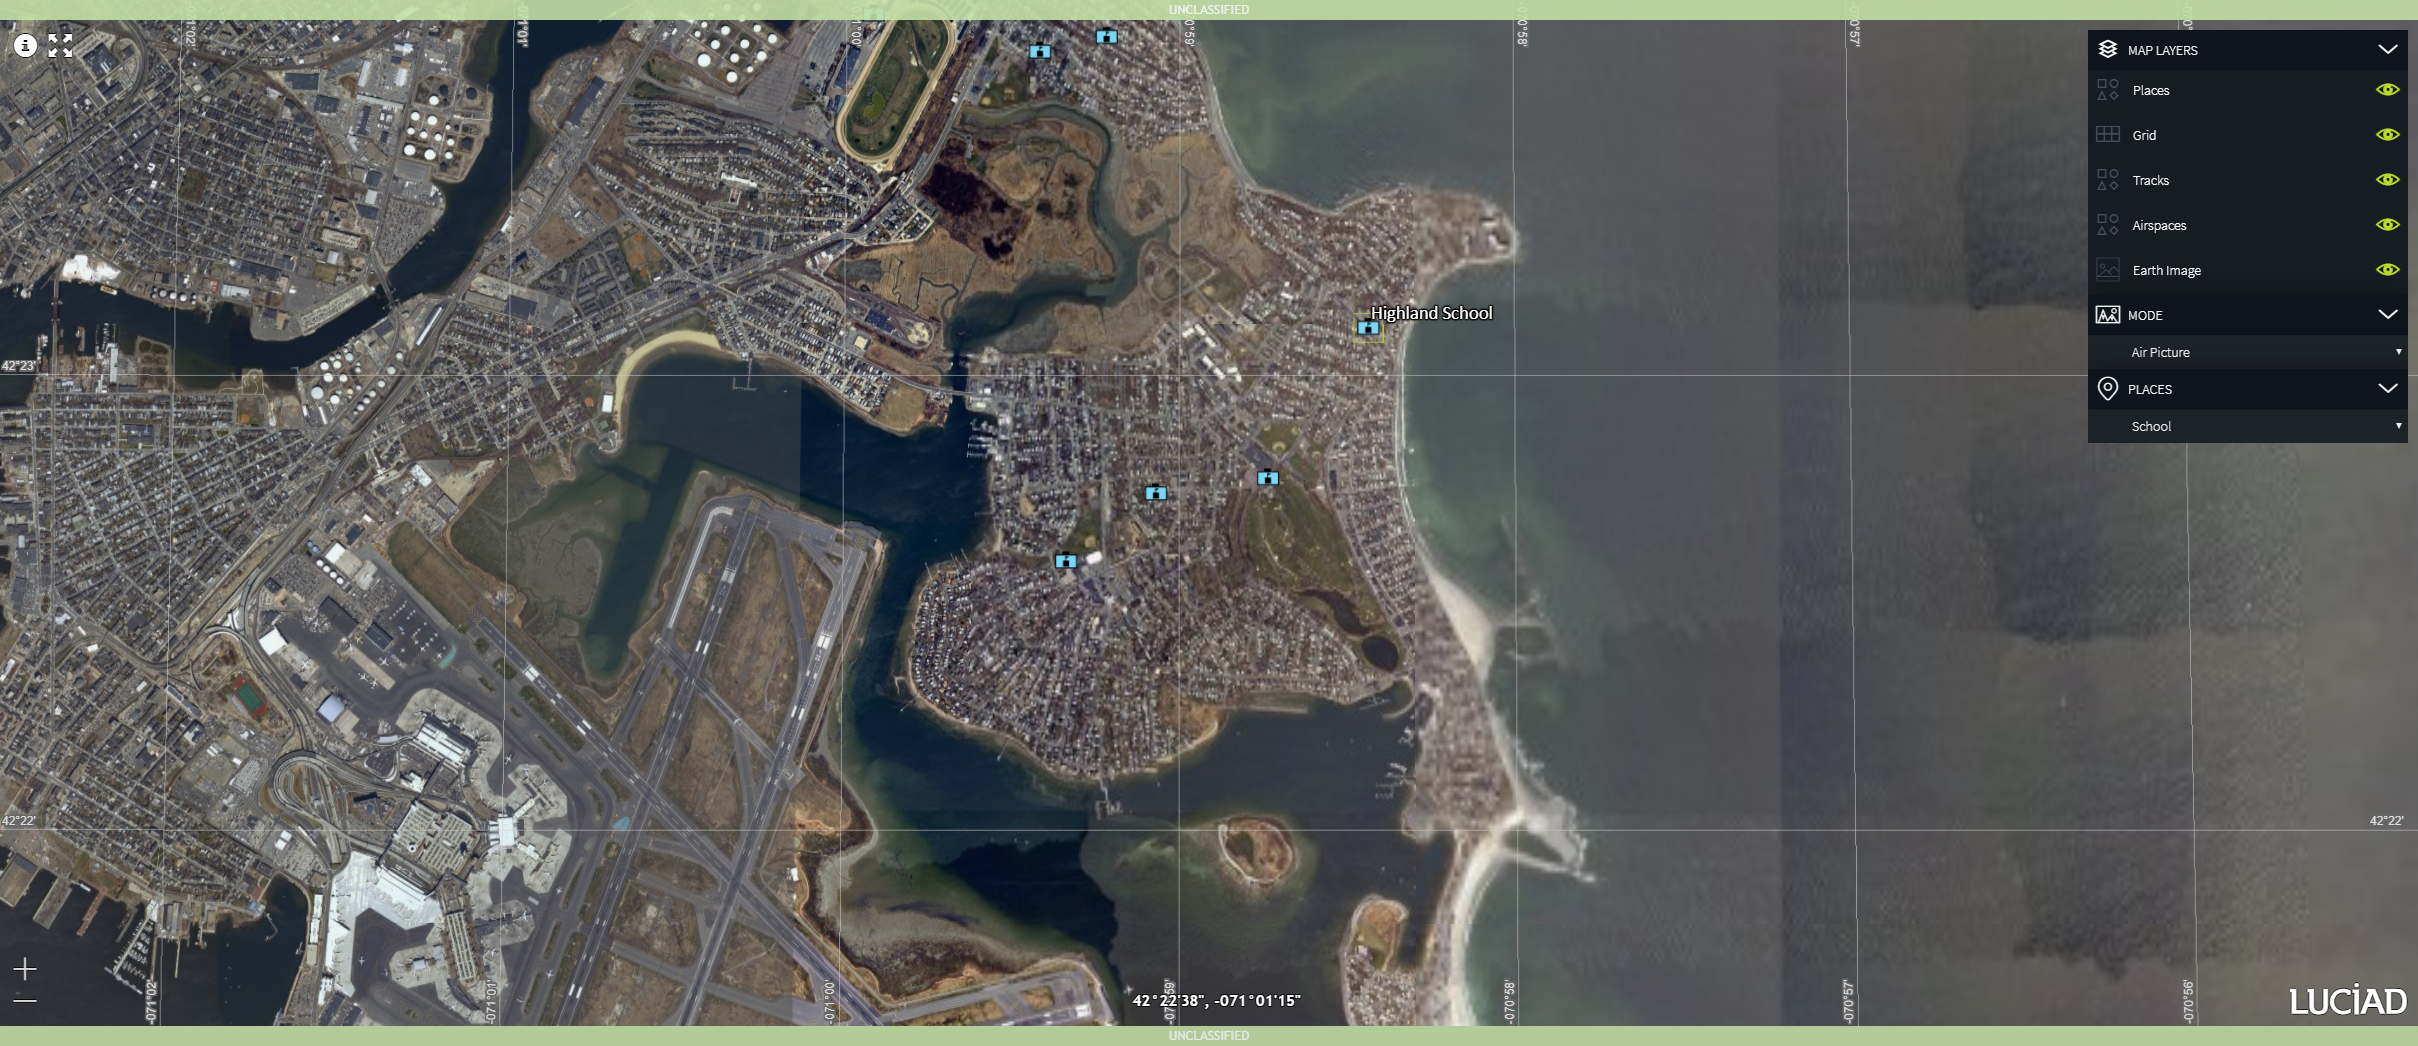
Once you have performed a gazetteer search, the COP demo also adds a Places layer to the list of layers in the Layer pane. To hide the gazetteer search results on the map, deselect the Places layer.
To see the name of a place returned by a gazetteer search, click it on the map. The place name will be displayed as a label.
4.4.2. Clustering objects
When there are many objects in a view, it becomes difficult to keep the overview. Therefore, the COP demo makes use of clustering to help reduce the clutter. A clustering algorithm automatically clusters objects that are close together. Zoom out of the map to see the clustering taking place. When you zoom in again, the clustered objects are unclustered again.
The cluster icon size depends on the number of cluster elements. That number is also added to the cluster as a label.
|
For an in-depth explanation of clustering see the chapter Clustering in the LuciadRIA developer’s guide. |