LuciadRIA offers support for the display of a latitude/longitude grid, as illustrated in Create and add a grid layer. In this tutorial, we illustrate how you can customize the grid by altering its properties.
Latitude/longitude grids are defined in view/grid/LonLatGrid.
To display a latitude/longitude grid, set its properties first.
A LonLatGrid object has the general properties of the grid itself, such as its origin and the increment size between consecutive latitude
and longitude lines.
You can configure styling options for the grid that determine how the map shows grid lines and grid labels. It’s possible to vary the increments based on the current scale of the map, for instance.
The next step is creating a view/grid/GridLayer, using the LonLatGrid instance that you have configured.
Program: creating a LonLatGrid and LonLatGridLayer illustrates how to create a LonLatGrid and GridLayer.
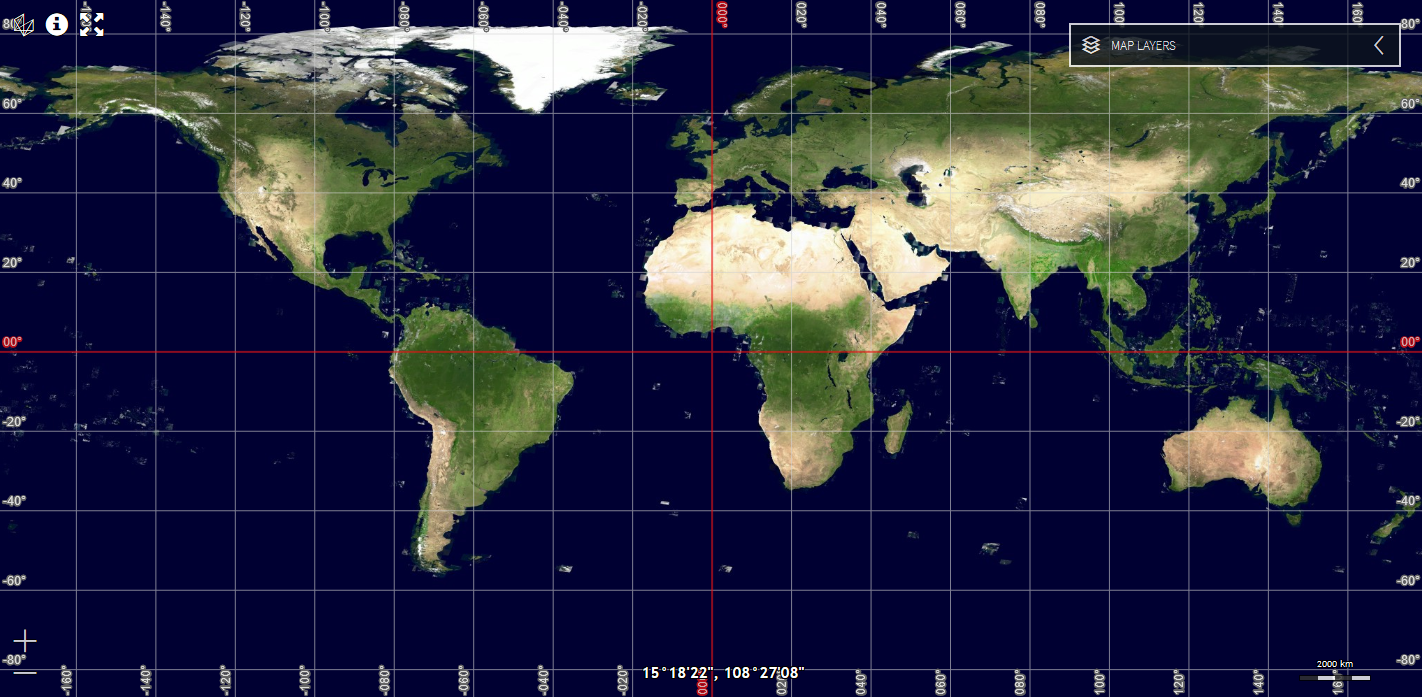
After configuring the grid scale ranges, the sample shows how to define a default line and label styling, with the labels
displaying the full latitude/longitude coordinates in degrees, minutes, and seconds.
Next, it adds an alternative label styling definition for certain scaling levels, so that the grid displays coordinates in
a reduced format when a map user zooms out.
In this case, the grid displays coordinates in degrees only.
Figure 1, “A latitude/longitude Grid” shows the result.
toolbox/ria/core/util/LayerFactory.ts)
/**
 * Returns a grid layer
 */
export function createGridLayer(): GridLayer {
  //Define scale ranges and create a grid
  const settings = [{
    scale: 40000.0E-9,
    deltaLon: 1 / 60,
    deltaLat: 1 / 60
  }, {
    scale: 20000.0E-9,
    deltaLon: 1 / 30,
    deltaLat: 1 / 30
  }, {
    scale: 10000.0E-9,
    deltaLon: 1 / 10,
    deltaLat: 1 / 10
  }, {
    scale: 5000.0E-9,
    deltaLon: 1 / 2,
    deltaLat: 1 / 2
  }, {
    scale: 1000.0E-9,
    deltaLon: 1,
    deltaLat: 1
  }, {
    scale: 200.0E-9,
    deltaLon: 5,
    deltaLat: 5
  }, {
    scale: 20.0E-9,
    deltaLon: 10,
    deltaLat: 10
  }, {
    scale: 9.0E-9,
    deltaLon: 20,
    deltaLat: 20
  }, {
    scale: 5.0E-9,
    deltaLon: 30,
    deltaLat: 30
  }, {
    scale: 0,
    deltaLon: 45,
    deltaLat: 45
  }];
  const grid = new LonLatGrid(settings);

  //Set the default styling for grid lines and labels
  grid.fallbackStyle = {
    labelFormat: new LonLatPointFormat({
      pattern: "lat(+DM),lon(+DM)"
    }),
    originLabelFormat: new LonLatPointFormat({
      pattern: "lat(+D),lon(+D)"
    }),
    originLineStyle: {
      color: "rgba(230, 20, 20, 0.6)",
      width: 2
    },
    lineStyle: {
      color: "rgba(210,210,210,0.6)",
      width: 1
    },
    originLabelStyle: {
      fill: "rgba(210,210,210,0.8)",
      halo: "rgba(230, 20, 20, 0.8)",
      haloWidth: 3,
      font: "12px sans-serif"
    },
    labelStyle: {
      fill: "rgb(220,220,220)",
      halo: "rgb(102,102,102)",
      haloWidth: 3,
      font: "12px sans-serif"
    }
  };

  //Use simplified labels when zoomed out a lot.
  const degreesOnlyFormat = new LonLatPointFormat({
    pattern: "lat(+D),lon(+D)"
  });
  grid.setStyle(grid.scales.indexOf(0), {
    labelFormat: degreesOnlyFormat
  });
  grid.setStyle(grid.scales.indexOf(5.0E-9), {
    labelFormat: degreesOnlyFormat
  });
  grid.setStyle(grid.scales.indexOf(9.0E-9), {
    labelFormat: degreesOnlyFormat
  });
  grid.setStyle(grid.scales.indexOf(20.0E-9), {
    labelFormat: degreesOnlyFormat
  });
  grid.setStyle(grid.scales.indexOf(200.0E-9), {
    labelFormat: degreesOnlyFormat
  });
  return new GridLayer(grid, {
    label: "Grid"
  });
}