Using the ParameterizedLinePainter, you can visualize line datasets with dynamic styling and filtering, and per-pixel styling.
This painter uses the graphics hardware to efficiently switch styling and filtering.
You can compare it to the TrajectoryPainter described in Visualizing trajectory lines is , but the ParameterizedLinePainter offers more options:
-
Property filtering: efficiently filter on feature properties.
-
Property styling: efficiently choose and switch colors based on feature properties.
-
Range filtering: filter parts of a line based on a range.
-
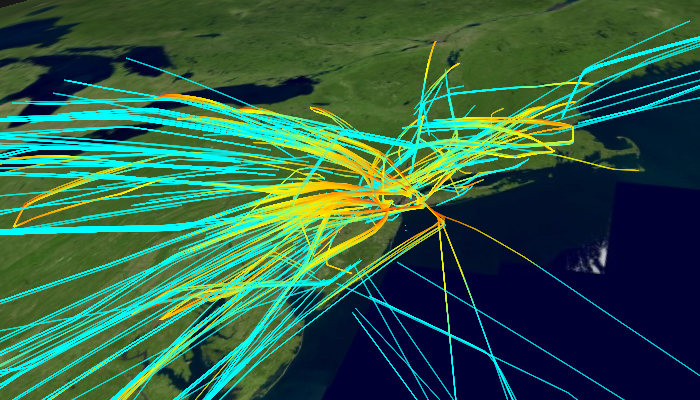
Per-pixel coloring: per-pixel color along a line based on a varying property with a range color map.
-
Density: you can combine this painter with regular density painting.
At runtime, you can efficiently change:
-
Styling expressions: instead of overriding
paintBody, you must configure a set of expressions that apply to all features, based on their properties. These expressions are automatically evaluated for each feature. You can use this to color lines based on properties, for example. -
A range window: you can configure a range window, and a function to set a range value for each point along your lines. Only the parts of your lines that correspond to the range window are painted. You can use this to only show parts of a line with high fuel consumption, for example.
-
Density: you can enable density using
FeaturePainter.density. See Density painting on a WebGLMap for more information.
Refer to the API documentation of ParameterizedLinePainter for more details and examples, and see the Parameterized Lines sample for an example.