FeatureLayer and FeaturePainter
You visualize vector features in a view/feature/FeatureLayer.
The most important aspect of a FeatureLayer is that it must define a view/feature/FeaturePainter.
The feature painter determines how the layer visualizes the features. You use the feature painter to:
-
Determine the style of the shapes
-
Define a label for a feature, illustrated in Labeling feature data.
The most important method on the FeaturePainter is the paintBody method:
paintBody(geoCanvas, //The GeoCanvas to render on
          feature,   //The Feature that should be rendered
          shape,     //The Shape to render
          layer,     //The layer containing the feature
          map,       //The map containing the layer
          paintState //The paint state, indicating whether the Feature is selected or not
);
With this method, you have full control over how you want to render the Feature, and what styling you want to use. For example, a straightforward implementation could be:
const featurePainter = new FeaturePainter();
//Use a custom paintBody implementation
featurePainter.paintBody = function(geoCanvas, feature, shape, layer, map, paintState) {
  geoCanvas.drawShape(shape, {
    stroke: {
      color: "rgb(0,0,255)",
      width: 5
    },
    fill: {color: "rgba(0,0,255,0.5)"}
  });
};
A feature painter visualizes and styles features by drawing them on a view/style/GeoCanvas instance.
The GeoCanvas instance is the first parameter of the painter’s draw methods.
It performs vector feature drawing operations in a geographical coordinate reference, which is identified through the reference
of the shape.
In this specific example, we:
-
Use the shape of the feature as the geometry to render
-
Specify a stroke and line color as styling
-
Use the same styling for all objects, even when they’re selected, because we’re ignoring the paint state.
More advanced examples are available in the rest of this tutorial.
|
For example, to achieve the behavior of the preceding example, you use a |
Styling options
You can style a shape in several ways:
-
You can render the shape as its shape type, and make use of the shape styling options offered by
view/style/ShapeStyle:-
stroke style: determine the style of the strokes that form the polylines and the outlines of polygons. You can choose between simple stroke style options or more complex stroked line styles. For a simple stroke style, use
view/style/LineStyle. It has options like the line color, line width and dashing. You can useview/style/complexstroke/ComplexStrokedLineStyleto achieve more complex stroked styles. It allows you to stroke a line with complex patterns composed of different shapes and text, through aview/style/complexstroke/PatternFactory. -
line markers: add markers at the beginning and the end of a line.
-
fill style determine how to fill the polygons. You can configure a fill style as a fill color or as a fill pattern. Fill styles don’t apply to polylines.
-
paint order: decide the visualization order of shapes in a layer.
-
line type: decide how to interpret lines between consecutive points in the shape. For shapes defined in a geodetic coordinate system, the line type translates to geodetic lines, if you chose the
SHORTEST_DISTANCEvalue, or rhumb lines if you chose theCONSTANT_BEARINGvalue.
-
-
You can render the shape as an icon. An icon is an image like a JPEG or PNG file.
-
You can display a text string at a shape’s focus point.
For detailed information on how to apply these styling options, see the API reference documentation.
The relevant classes and objects for styling are view/style/GeoCanvas, view/style/ShapeStyle, view/style/IconStyle, view/style/FillStyle, view/style/LineStyle and view/style/complexstroke/ComplexStrokedLineStyle.
Examples
Distinct styling for selected objects
In the following example, we use distinct styling for selected and non-selected objects. We check the `paintState`before deciding which styling to use.
In the example, zones are polygons drawn with a fill and stroke style. If a user selects an object, we want to use a distinct stroke color, stroke width and dashing pattern. Selected objects also have a fill pattern, on top of the background color.
FeaturePainter that styles polygons differently based on their selection status (from samples/selection/painters/AirspacePainter.ts)
export class AirspacePainter extends FeaturePainter {
private readonly _selectedPattern: HTMLImageElement;
private readonly _nameTemplate: string;
constructor() {
super();
this._selectedPattern = new HatchedImageBuilder()
.patterns([HatchedImageBuilder.Pattern.SLASH, HatchedImageBuilder.Pattern.BACKGROUND])
.lineColor("rgba( 255, 255, 255, 0.5)")
.lineWidth(4)
.patternSize(20, 20)
.backgroundColor("rgba(0 ,0 , 255, 0.5)")
.build();
this._nameTemplate = '<div style="color: rgb(250,255,250); font-size: 14px">$name</div>';
}
override paintBody(geoCanvas: GeoCanvas, feature: Feature, shape: Shape, layer: Layer, map: RIAMap,
paintState: PaintState): void {
const style: ShapeStyle = {
stroke: {
color: "rgb(0,0,255)",
width: 5
},
fill: {
color: "rgba(0,0,255,0.5)"
}
};
const stroke = style.stroke as LineStyle;
if (paintState.selected) {
stroke.color = "rgb(255,99,71)";
stroke.dash = [8, 2];
style.fill!.image = this._selectedPattern;
} else if (paintState.hovered) {
style.fill!.color = "rgba(100,100,255,0.5)";
stroke.color = "rgb(100,100,255)";
}
geoCanvas.drawShape(shape, style);
};
override paintLabel(labelCanvas: LabelCanvas, feature: Feature, shape: Shape, layer: Layer, map: RIAMap,
paintState: PaintState): void {
const name = this._nameTemplate.replace("$name", feature.properties["Name"]);
if (paintState.selected) {
labelCanvas.drawLabelInPath(name, shape, {});
} else {
labelCanvas.drawLabelInPath(name, shape, {});
}
};
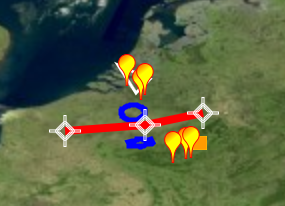
}Advanced example: flight plan with waypoints
This example shows a more complex painter. It draws a polyline that represents a flight track, as a wide yellow line. On top of this line, and each point of the track, it draws a waypoint icon.
When a user selects the track is selected, the line becomes red.
const style = {
  strokeWidth: 6,
  stroke: {
    color: "rgba(255,255,0,1)"
  }
};
const selectedStyle = {
  strokeWidth: 6,
  stroke: {
    color: "rgba(255,255,0,1)"
  }
};

const painter = new FeaturePainter();
painter.paintBody = function(geoCanvas, feature, shape, layer, map, paintState) {
  if (shape instanceof Polyline) {
    let i;
    // draw a line, style depends on whether the line is selected or not
    geoCanvas.drawShape(shape, paintState.selected ? selectedStyle : style);
    // and draw an icon on each point in the polyline
    i = shape.pointCount;
    while (i--) {
      geoCanvas.drawIcon(shape.getPoint(i), {
        url: "../../resources/img/waypoint.png",
        width: "32px",
        height: "32px",
        offsetX: -16,
        offsetY: -16
      });
    }
  }
};
For the complete list of supported drawing operations on the GeoCanvas, see the API reference.