A legend for your SLD map
By adding a legend to your map, you can improve user experience. In a legend, you use simple images and descriptions to explain what the map shows.
Creating entries for your legend
Legend entries can be regular Features resembling the features on your map, one for each type of visualisation.
You can create any feature with properties to trigger the right SLD style for the visualization type.
import {Feature} from "@luciad/ria/model/feature/Feature.js";
import {createPoint} from "@luciad/ria/shape/ShapeFactory.js";
import {getReference} from "@luciad/ria/reference/ReferenceProvider.js";

const pointShape = createPoint(getReference("CRS:84"), [0, 0]);
const cityLegendFeature = new Feature(pointShape, {SCALERANK: 1, NAME: "LA"}, 0);
However, the style as defined in your SLD file for regular map features might not lead to an optimal legend preview. Legend icons might be too small or too big, text might become unreadable, world-sized styling might lead to unexpected images.
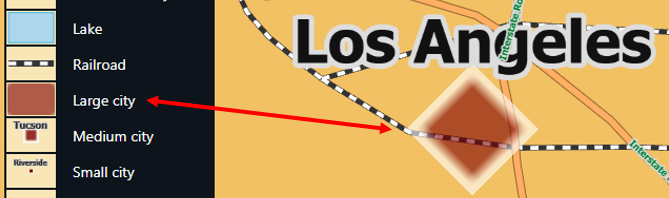
For the cityLegendFeature defined in Program: Create a legend feature for big cities , that could lead to the image in Figure 2, “world-sized icon in a legend”.
What happened here is that the world-sized styling defined for these large cities is applied to the legend icon as well, making
the icon too big for the legend image.
To fix this issue of non-appropriate legend styling, you must combine two mechanisms. First, you define legend-specific styling in your SLD files using the vendor option 'inclusion'. Next, you must create a dedicated painter for legend entries.
Defining legend-specific SLD styling with vendor option 'inclusion'
You can use the vendor option inclusion to differentiate between styling on a regular map and styling for a legend.
It defines whether LuciadRIA uses a particular element Rule, FeatureTypeStyle or Symbolizer when it generates
either map output or legend output.
This vendor option allows you to generate appropriate legend images, either by setting a pre-defined image for use in the
legend,
or by changing the style to skip complexity, labeling, and replace world-sized styling — a key benefit when you’re using the
LuciadRIA LegendPanel.
To set the inclusion vendor option, add this to the appropriate style element in your SLD file:
<VendorOption name="inclusion">legendOnly</VendorOption>Valid values are:
-
legendOnly: skip the style element when painting on a regular map. To use these legend styles, you must create a special painter for legend entries, the regular Symbology Encoding painter skips these styles.
-
mapOnly: skip the style element when painting legends. The regular Symbology Encoding painter uses these styles.
-
normal: use the style element for both map and legend painting. The regular Symbology Encoding painter uses these styles.
The normalvalue has the same effect as omitting the vendor option.
Example using a pre-defined image
In SLD Rule for 'large cities - zoomed in', you can see that the rule for "Large cities - zoomed in" contains a world-sized
point symbolizer and a world-sized text symbolizer.
They could lead to the incorrectly sized legend icon in Figure 2, “world-sized icon in a legend”.
However, in this SLD, both symbolizers are marked as mapOnly.
Next to them, there is another legendOnly point symbolizer, merely pointing to a pre-defined image for the legend entry as shown in this figure.

Expand for the code to create the "Large city" legend:
<?xml version='1.0' encoding='UTF-8'?>
<FeatureTypeStyle xmlns="http://www.opengis.net/se"
                  xmlns:ogc="http://www.opengis.net/ogc"
                  xmlns:gml="http://www.opengis.net/gml"
                  xmlns:xlink="http://www.w3.org/1999/xlink"
                  xmlns:xsi="http://www.w3.org/2001/XMLSchema-instance"
                  xsi:schemaLocation="http://www.opengis.net/ogc
                   http://schemas.opengis.net/filter/1.1.0/filter.xsd
                   http://www.opengis.net/se
                   http://schemas.opengis.net/se/1.1.0/FeatureStyle.xsd
                   http://www.w3.org/1999/xlink
                   http://www.w3.org/1999/xlink.xsd "
                  version="1.1.0">
  <Description>
    <Title>Populated places</Title>
  </Description>
  <Rule>
    <Description>
      <Title>Large cities - zoomed in</Title>
    </Description>
    <MaxScaleDenominator>6.0E5</MaxScaleDenominator>
    <ogc:Filter>
      <ogc:PropertyIsBetween>
        <ogc:PropertyName>SCALERANK</ogc:PropertyName>
        <ogc:LowerBoundary>
          <ogc:Literal>1</ogc:Literal>
        </ogc:LowerBoundary>
        <ogc:UpperBoundary>
          <ogc:Literal>2</ogc:Literal>
        </ogc:UpperBoundary>
      </ogc:PropertyIsBetween>
    </ogc:Filter>
    <PointSymbolizer>
      <Graphic>
        <ExternalGraphic>
          <OnlineResource xlink:href="/sampledata/img/LargeCity2SLDLegend.png"/>
          <Format>image/png</Format>
        </ExternalGraphic>
        <Size>45</Size>
      </Graphic>
      <VendorOption name="inclusion">legendOnly</VendorOption>
    </PointSymbolizer>
    <PointSymbolizer uom="http://www.opengeospatial.org/se/units/metre">
      <Graphic>
        <ExternalGraphic>
          <InlineContent encoding="base64">
            iVBORw0KGgoAAAANSUhEUgAAAAgAAAAICAYAAADED76LAAAAH0lEQVQYV2P8DwQMeAAjSEEdIyNWJU1AvUNHAT5vAgDR8jHptuzwOwAAAABJRU5ErkJggg==
          </InlineContent>
          <Format>image/png</Format>
        </ExternalGraphic>
        <Size>
          2800
        </Size>
        <Opacity>0.6</Opacity>
        <Rotation>45</Rotation>
      </Graphic>
      <VendorOption name="inclusion">mapOnly</VendorOption>
    </PointSymbolizer>
    <TextSymbolizer uom="http://www.opengeospatial.org/se/units/metre">
      <Label>
        <ogc:PropertyName>NAME</ogc:PropertyName>
      </Label>
      <LabelPlacement>
        <PointPlacement>
          <Displacement>
            <DisplacementX>0</DisplacementX>
            <DisplacementY>2500</DisplacementY>
          </Displacement>
        </PointPlacement>
      </LabelPlacement>
      <Font>
        <SvgParameter name="font-family">Tahoma</SvgParameter>
        <SvgParameter name="font-weight">bold</SvgParameter>
        <SvgParameter name="font-size">1800</SvgParameter>
      </Font>
      <Halo>
        <Radius>150</Radius>
        <Fill>
          <SvgParameter name="fill">#dddddd</SvgParameter>
        </Fill>
      </Halo>
      <Fill>
        <SvgParameter name="fill">#111111</SvgParameter>
      </Fill>
      <VendorOption name="inclusion">mapOnly</VendorOption>
    </TextSymbolizer>
  </Rule>
</FeatureTypeStyle>
Example using altered styling
In SLD FeatureTypeStyle for 'US rail roads', you can see two rules containing world-sized line symbolizers,
marked mapOnly. They have appropriate pixel-sized counterparts, marked legendOnly.
They make sure that the legend entry for the railroad has a nice railroad style.
Expand for the code to create the "Railroad" legend:
<?xml version='1.0' encoding='UTF-8'?>
<FeatureTypeStyle xmlns="http://www.opengis.net/se" xmlns:xsi="http://www.w3.org/2001/XMLSchema-instance"
                  xsi:schemaLocation="http://www.opengis.net/se http://schemas.opengis.net/se/1.1.0/FeatureStyle.xsd"
                  version="1.1.0">
  <Description>
    <Title>US rail roads</Title>
  </Description>
  <Rule>
    <MaxScaleDenominator>2.0E4</MaxScaleDenominator>
    <LineSymbolizer uom="http://www.opengeospatial.org/se/units/metre">
      <Stroke>
        <SvgParameter name="stroke">#333333</SvgParameter>
        <SvgParameter name="stroke-width">4</SvgParameter>
      </Stroke>
      <VendorOption name="inclusion">mapOnly</VendorOption>
    </LineSymbolizer>
    <LineSymbolizer>
      <Stroke>
        <SvgParameter name="stroke">#333333</SvgParameter>
        <SvgParameter name="stroke-width">8</SvgParameter>
      </Stroke>
      <VendorOption name="inclusion">legendOnly</VendorOption>
    </LineSymbolizer>
  </Rule>
  <Rule>
    <MaxScaleDenominator>2.0E4</MaxScaleDenominator>
    <LineSymbolizer uom="http://www.opengeospatial.org/se/units/metre">
      <Stroke>
        <SvgParameter name="stroke">#ffffff</SvgParameter>
        <SvgParameter name="stroke-width">3</SvgParameter>
        <SvgParameter name="stroke-dasharray">7 7</SvgParameter>
      </Stroke>
      <VendorOption name="inclusion">mapOnly</VendorOption>
    </LineSymbolizer>
    <LineSymbolizer>
      <Stroke>
        <SvgParameter name="stroke">#ffffff</SvgParameter>
        <SvgParameter name="stroke-width">5</SvgParameter>
        <SvgParameter name="stroke-dasharray">10 10</SvgParameter>
      </Stroke>
      <VendorOption name="inclusion">legendOnly</VendorOption>
    </LineSymbolizer>
  </Rule>
</FeatureTypeStyle>
Creating a painter for legend entries
The regular painter for symbology encoding renders for the map, ignoring all styling flagged with
the vendor option inclusion set to legendOnly.
If you want to render for the legend, you must create the painter with an explicit painterType set to legend.
Program: creating a legend painter demonstrates how to create a painter that uses only
legend styles and normal styles, and ignores map styles.
Thus, this painter ignores all styling flagged with the vendor option inclusion set to mapOnly.
samples/symbologyencoding/SampleLayer.ts)
const legendPainter = await createPainterFromString(seSource, {
  strict: true,
  functionEvaluators: roadFunctionEvaluators,
  painterType: "legend",
});
LegendPanel and Legend Toolbox
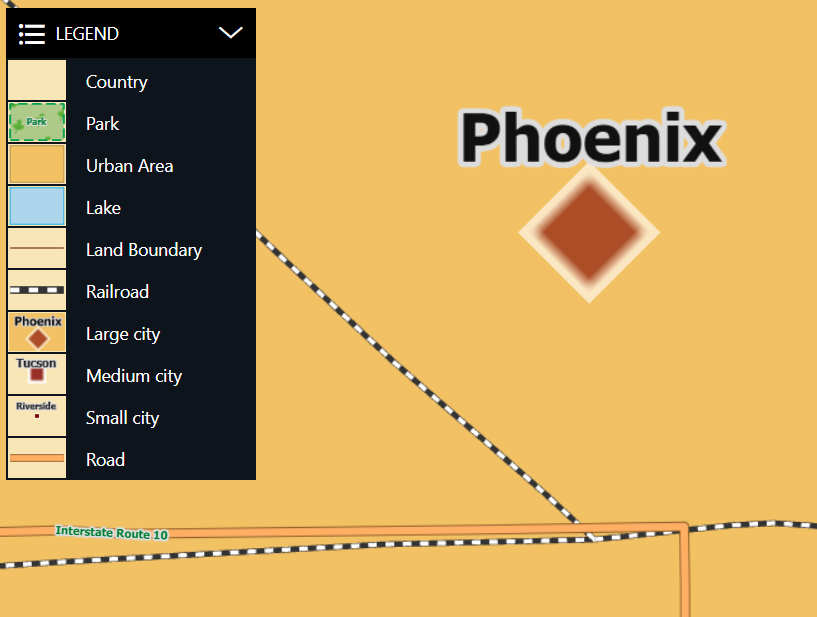
To create a LegendPanel as shown in Figure 1, “Legend panel in the LuciadRIA Symbology Encoding sample”, you can use the LegendPanel available
in the LuciadRIA samples. See samples/common/ui/overlay/LegendPanel.tsx in your LuciadRIA distribution.
You can also make use of the Legend tools in the LuciadRIA Toolbox. See the toolbox/ria/legend directory. These legend tools
allow you to create nice-looking, dynamic legends for a map with one or more feature layers.