When you are visualizing a line between two points, you may need to offer a richer visualization at one or more intermediate points on that line.
Common examples include:
-
Displaying a text annotation at one or more intermediate locations of a line, to show the length of a line segment measured with a ruler.
-
Showing one or more icons at one or more intermediate locations of the line, such as an airplane icon along a trajectory.
-
Showing a label at a fixed location on the line. Instead of relying on the automatic placement of a label along the line, you want to fix the label position.
How to do it?
The high-level steps for marking intermediate points on a line are:
-
Compute one or more intermediate points between two points of the line you are visualizing.
-
Draw the original line
-
Draw the extra visualization at the intersection point computed in step 1.
To carry out those steps, you need to combine two parts of the LuciadRIA API.
-
Use the
Geodesycomponent to calculate the correct position of one or more intermediate points. Here you need to select a line type:-
LineType.SHORTEST_DISTANCE: traces the shortest distance on the surface of the earth between two points. This is a geodetic line. -
LineType.CONSTANT_BEARING: traces a line of constant bearing on the surface of the earth between two points. This is a rhumb line, meaning that the line crosses all meridians at the same angle.
-
-
Define the visualization of the object. Your approach depends on the goal you want to achieve:
-
If you are visualizing data in a
FeatureLayer, implementFeaturePainter.paint[Body|Label]. -
If you are defining the visualization of a
Controller, implement theController.onDraw()method.
-
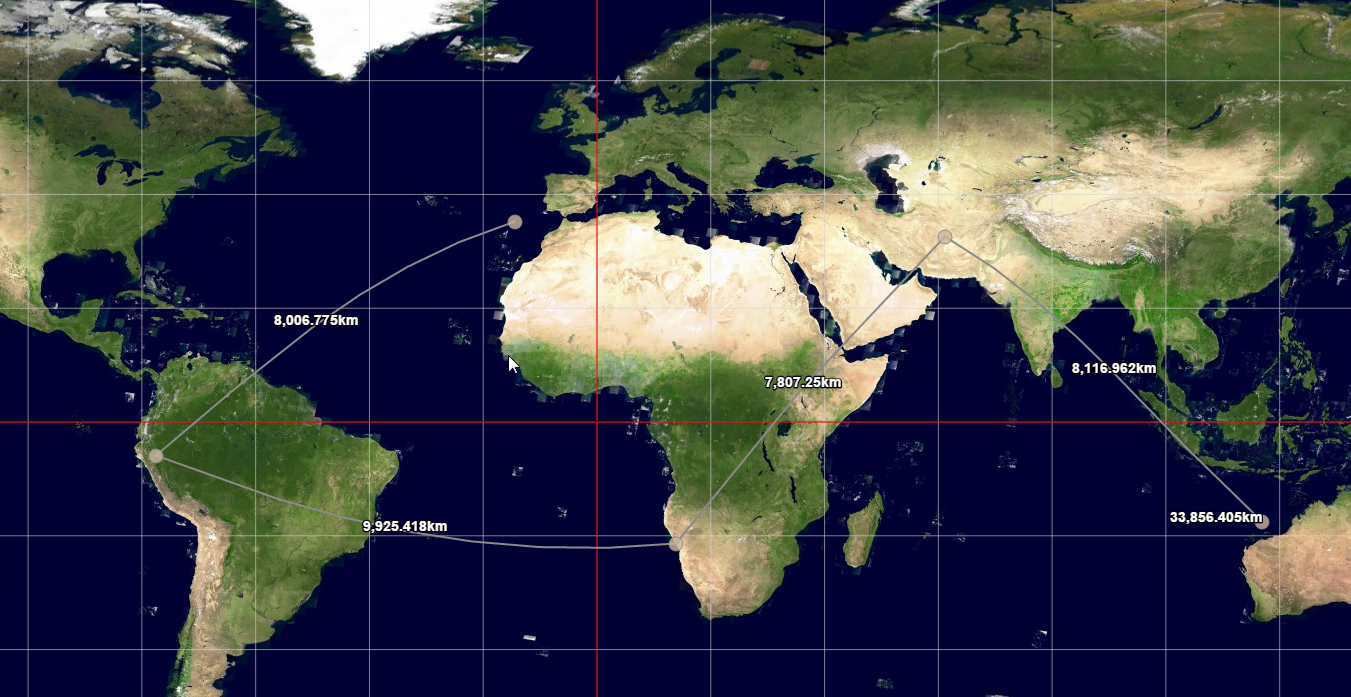
Example 1. Drawing annotations at intermediate line locations
In the example code below, we draw a text label showing the distance of each line segment. The label is positioned at the halfway point of the segment.
-
Create the Geodesy utility.
this._geodesy = GeodesyFactory.createEllipsoidalGeodesy(this._shapeReference); -
Compute the halfway point and draw text on the line in the
FeaturePainter.paintLabelorController.onDraw()method.var halfwayPoint, i, distance; for (i = 0; i < this._polyLine.pointCount - 1; i += 1) { halfwayPoint = this._geodesy.interpolate(this._polyLine.getPoint(i), this._polyLine.getPoint(i + 1), 0.5, LineType.SHORTEST_DISTANCE); distance = this._geodesy.distance(this._polyLine.getPoint(i), this._polyLine.getPoint(i + 1), LineType.SHORTEST_DISTANCE); geoCanvas.drawText(halfwayPoint, this._formatDistance(distance), { textAnchor: "center", font: "bold 14px sans-serif", fill: "rgb(255,255,255)", halo: "rgb(0,0,0)", haloWidth: 3 }); }
The result looks like this image of several measurements taken with a ruler:
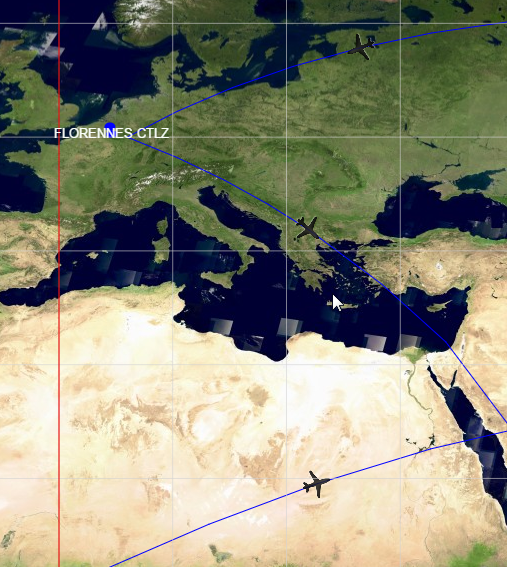
Example 2. Drawing an icon at an intermediate point
The following example is a variation on the preceding example. Instead of drawing a controller annotation, we now draw an airplane icon midway on a flight trajectory segment. To draw the icon midway on a line:
-
We change the
FeaturePainter.paintBody()method. -
We draw an airplane icon in the middle of the line, using the same technique as in the earlier example to compute the midpoint.
-
We split the original line segment in two, to make sure that the line connects to the icon. To optimize performance, we calculate the arc of a trajectory line as an approximation. It may not pass through the midpoint calculated with the exact
GeodesyFactory.interpolate()method. By splitting the line segment in half and connecting the two halves to the precisely calculated midpoint, we make sure that the icon is perfectly aligned with the trajectory line. -
We find the azimuth at that given point using the
GeodesyFactory.azimuth()calculation, and rotate the icon according to that azimuth.
var linePainter = new FeaturePainter();
linePainter.paintBody = function(geoCanvas, feature, shape, map, layer, state) {
  var geodesy = GeodesyFactory.createEllipsoidalGeodesy(shape.reference);
  var i, midway, azimuth;
  for (i = 0; i < shape.pointCount - 1; i += 1) {
    midway = geodesy.interpolate(shape.getPoint(i), shape.getPoint(i + 1), 0.5, LineType.SHORTEST_DISTANCE);
    geoCanvas.drawShape(ShapeFactory.createPolyline(shape.reference, [shape.getPoint(i), midway]), {
      stroke: {
        color: "rgb(0,0,255)"
      }
    });
    geoCanvas.drawShape(ShapeFactory.createPolyline(shape.reference, [midway, shape.getPoint(i + 1)]), {
      stroke: {
        color: "rgb(0,0,255)"
      }
    });
    azimuth = geodesy.forwardAzimuth(midway, shape.getPoint(i + 1), LineType.SHORTEST_DISTANCE);
    geoCanvas.drawIcon(midway,{
      url: "airplane.png",
      width:"32px",
      height: "32px",
      rotation: azimuth
    })
  }
};
The result looks like this image of several line trajectories displaying an airplane icon in the middle: