This article describes how to create, visualize, and decorate bordered maps using the map-borders component in the LuciadRIA Toolbox. The map-borders tools allow you to add axes and custom content to your bordered map.
Bordered maps are typically shown below regular LuciadRIA maps that represent features on Earth’s surface. Bordered maps often present those features in a cartesian view, with the geospatial data mapped onto axes in a graph.
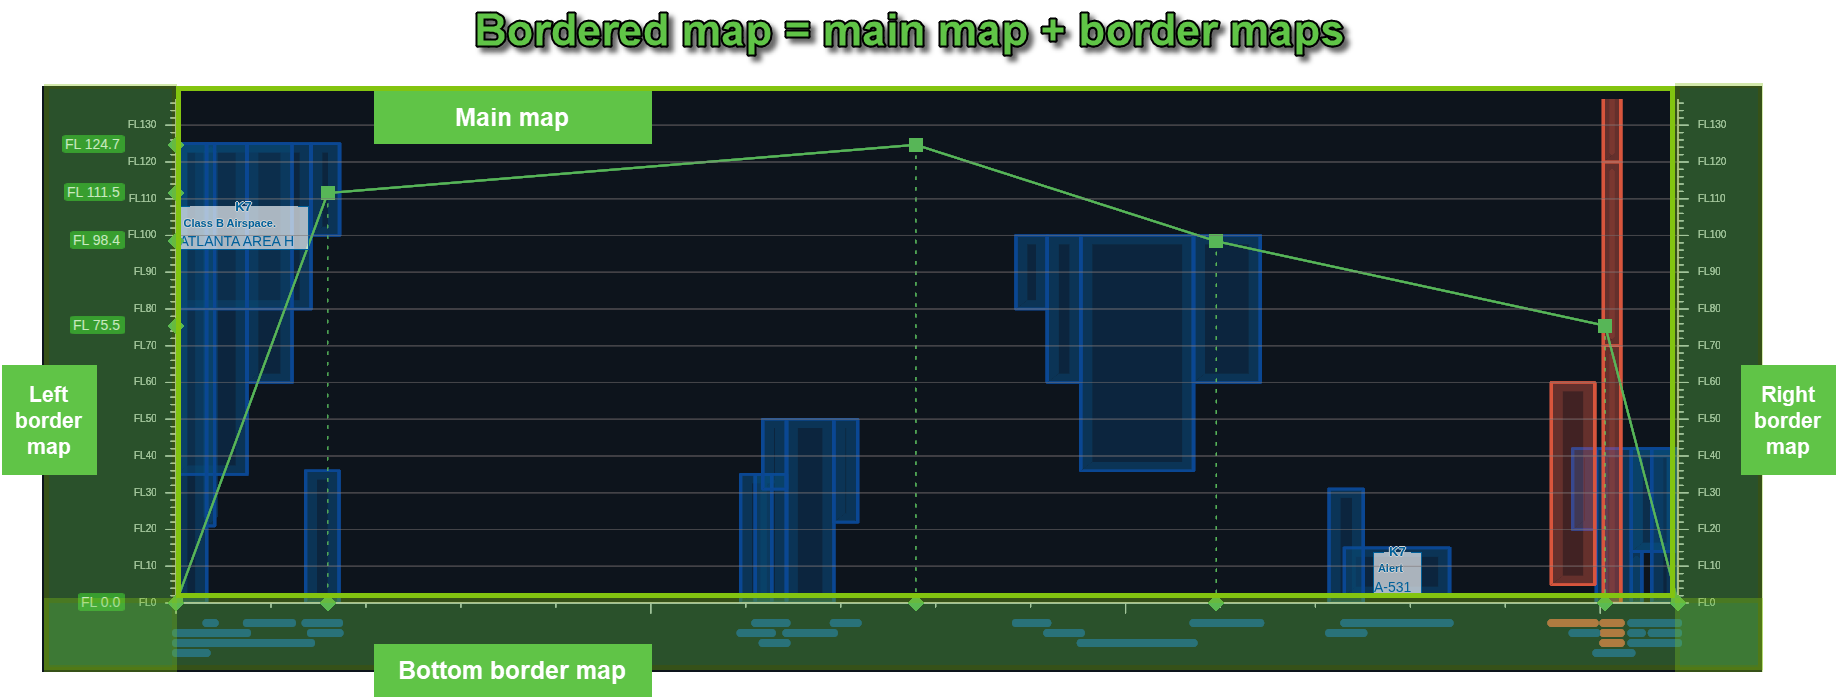
A common example is a vertical view, which shows some type of height range on the graph’s Y-axis, and uses the elevation information of a feature to show it on the graph. The LuciadRIA Vertical View sample shows aircraft trajectories and airspaces in this way. Another example of a cartesian view in a bordered map is a timeline that uses the timing information of a geospatial feature to map it onto a time-based X-axis. For an example, see the LuciadRIA Timeline sample.
A bordered map consists of:
-
A main map: showing geospatial data in a cartesian view
-
Optional border maps: border space at the top, bottom, left, or right of the main map, for the placement of axes and other content, such as labels.
Compose a bordered map
To create a bordered map, use the BorderedMap class from the map-borders component in the LuciadRIA Toolbox.
It mounts the main map together with any enabled border maps into a host element.
To enable a border map, specify its size. If you want to attach an axis to the border map, use axisConfiguration.
If a border map has size > 0 but no axisConfiguration, it won’t render any axis by design. You can still draw custom content on it, though.
Set the constructor parameters
To configure a bordered map, set its constructor parameters:
-
domNode: container element for the composed map view -
mapOptions: options (RIAMapConstructorOptions) for the mainRIAMap -
options: per-border configuration (sizein pixels,axisConfiguration).
const reference = createCartesianReference({
  xUnitOfMeasure: getUnitOfMeasure("NauticalMile"),
  yUnitOfMeasure: getUnitOfMeasure("FlightLevel")
});
const borderedMap = new BorderedMap(containerNode, {reference}, {
  left: {size: 120, axisConfiguration: leftAxis},
  bottom: {size: 56, axisConfiguration: bottomAxis},
  right: {size: 72}   // no axis, free for custom drawings
});
Define the layout of a border map
The bordered map optionally includes left, right, top, and bottom border maps alongside the main map.
A border map is created only if you define it in the options and its size is greater than 0.
If you provided an axisConfiguration, the corresponding axis is rendered along that border.
Adjacent border maps overlap at the corners. For example, the bottom and left borders share a corner area that can contain drawings from both maps.
Border maps also extend over the main map to ensure that their drawings, such as grid lines, are always rendered above the main map’s content.

Configure axes
Each border can have an optional axis controlled by an AxisConfiguration.
It defines axis styles, labels, ticks, and grid behavior. All properties are optional.
Key options:
-
axisLineStyle: define the style of the main axis line. -
gridLine: extend major ticks as grid lines. -
labelFormat: format tick labels. -
labelStyle,labelRotation: control label appearance and rotation. -
tickLength,subTickLength: set tick length. -
spacing: control the distance between major ticks. -
subTicks: use a number or function to determine sub-ticks between major ticks.
Axes are rendered through an internally created AxisLayer that uses an AxisPainter.
This layer is automatically attached to the corresponding border map.
| The axis is drawn only on the part of the border map that directly touches the main map. |
For detailed options, see the AxisConfiguration API in the LuciadRIA Toolbox.
Draw on border maps using border layers
To render custom drawings on a border map, use the BorderedMap method projectLayerToBorder.
It creates a new FeatureLayer on the specified border map. This new layer is based on an existing layer from the main map.
The new layer re-uses the model and shapeProvider of the source layer, and internally creates a BorderShapeProvider
to supply shapes to the painter in the border map reference, projected along the axis.
You can provide a custom painter to control how the layer content is rendered on the border map.
const borderMap = borderedMap.getBorderMap('bottom');
const borderLayer = borderedMap.projectLayerToBorder(
    trajectoryLayer, 'bottom', new TrajectoryBorderPainter()
);
if (borderMap && borderLayer) {
  borderMap.layerTree.addChild(borderLayer);
}
Alternatively, you can use createBorderMapLayer(model, borderType, layerOptions) to create a border layer directly
from a FeatureModel, without referencing an existing layer from the main map.
If the model’s reference isn’t compatible with the main map, provide a shapeProvider in layerOptions to handle the conversion.
Internally, this method creates a BorderShapeProvider so the painter receives shapes in the border map’s reference, projected along the axis.
Work with the border shape provider
The BorderShapeProvider is attached to layers created through projectLayerToBorder or createBorderMapLayer.
It’s responsible for projecting feature shapes from the main map into the reference of the border map axis.
When a feature’s shape is requested, the BorderShapeProvider transforms it so that it lies on the axis of the active border map.
Its behavior depends on the input shape type:
-
For
PolylineandPolygon, all vertices are projected onto the axis, and the result is returned as aPolyline. -
For
Point, the point is projected onto the axis. -
For
ShapeList, all child shapes are transformed recursively. -
For pattern-based shapes such as
ArcandCircle, the shape is simplified to a 2-pointPolylinebased on its bounding-box diagonal.
Control the visibility of projected shapes
The shapes provided by the BorderShapeProvider are projected onto the axis of the active border map.
You can vertically offset these shapes by a specified number of pixels to adjust their placement relative to the axis line.
Because a border map typically extends beyond the visible axis, in overlapping adjacent borders for example,
projected shapes may also be drawn outside the visible section of the rendered axis.
To restrict rendering to the visible part only, you can use the isBorderPointInAxisRange(point) utility. It checks whether a point lies within the visible axis range of the border map.
export class BorderPainter extends FeaturePainter {
  paintBody(geoCanvas: GeoCanvas, _feature: Feature, shape: Polyline, layer: BorderFeatureLayer) {
    for (let i = 0; i < shape.pointCount; i += 1) {
      const pointOnAxis = shape.getPoint(i);
      if (layer.shapeProvider.isBorderPointInAxisRange(pointOnAxis)) {
        geoCanvas.drawIcon(pointOnAxis, borderIconStyle);
      }
    }
  }
}
Work with border controllers
By default, border maps handle mouse and touch events to support basic navigation:
-
Panning along the border axis
-
Zooming by changing the scale factor along the axis
Rotation isn’t supported.
You can attach more custom controllers to border maps to implement your own interaction logic.
By default, view areas shared by adjacent border maps, such as the left-bottom corner, don’t consume input events.
You can adjust this behavior by using getAxisUomVisibleRange to refine your hit-testing and event routing.
|