Why do it?
When you visualize a geometry containing lines, such as a polyline or a polygon, LuciadRIA by default draws lines that have a constant width expressed in pixels. The width of those lines doesn’t change when the map user zooms in or out, or when the map represents a 3D scene with perspective.
This article shows you how you can draw lines using world units that represent the actual size of real-world objects, such as meters or feet. As a result, the line width adapts to a 3D perspective, or when users zoom in or out of the map.
How to do it?
When you draw your geometries, you can apply a style that identifies a unit of measure. You can choose between two styling approaches:
-
Use the
uomproperty in the styling API. -
Use a Symbology Encoding (SE) style sheet, an XML format that conforms with the OGC Symbology Encoding specification. It specifies a unit of measure for symbolizers.
Using the styling API
Applying unit of measure on the LineStyle and ComplexStrokedLineStyle API
The LineStyle and ComplexStrokedLineStyle API has a unit of measure uom property. It determines how LuciadRIA interprets properties that express a size.
You can retrieve supported unit of measure values in this way:
-
UnitOfMeasureRegistry.getUnitOfMeasure("Pixels") -
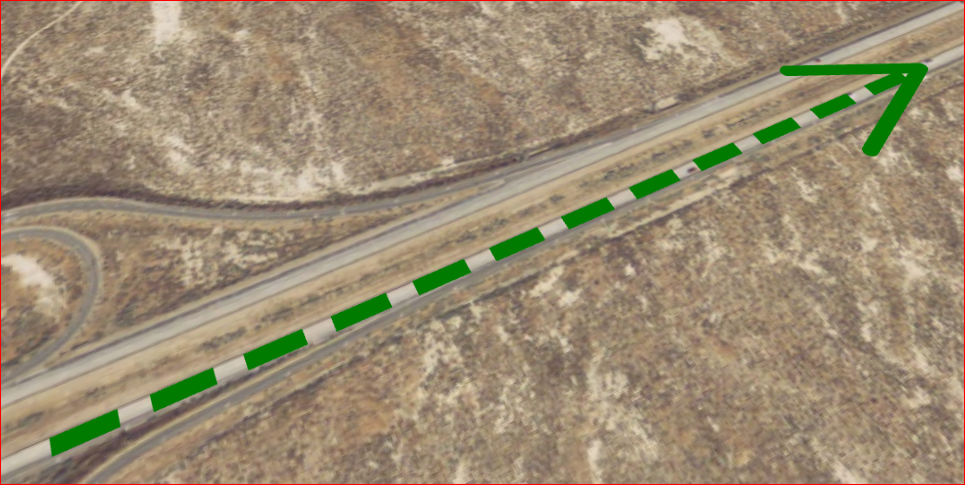
UnitOfMeasureof typeQuantityKindRegistry.getQuantityKind("Length"), for exampleUnitOfMeasureRegistry.getUnitOfMeasure("Meter")orUnitOfMeasureRegistry.getUnitOfMeasure("Foot")This code shows how to style features as a 10-meter wide dashed line, consisting of 30-meter long dash segments, gap segments of 15 meters, and an arrow marker with an 80-meter head size.
var painter = new FeaturePainter();
painter.paintBody = function(geocanvas, feature, shape, layer, map, paintState) {
  geocanvas.drawShape(shape, {
    stroke: {
      color: "green",
      width: 10,
      uom: UnitOfMeasureRegistry.getUnitOfMeasure("Meter"),
      dash: [30, 15],
      endMarker: {
        size: 80
      }
    }
  });
};
The result is:
Applying unit of measure in the BorderStyle API
The BorderStyle API also has an uom property to identify the unit of measure for borders of closed shapes.
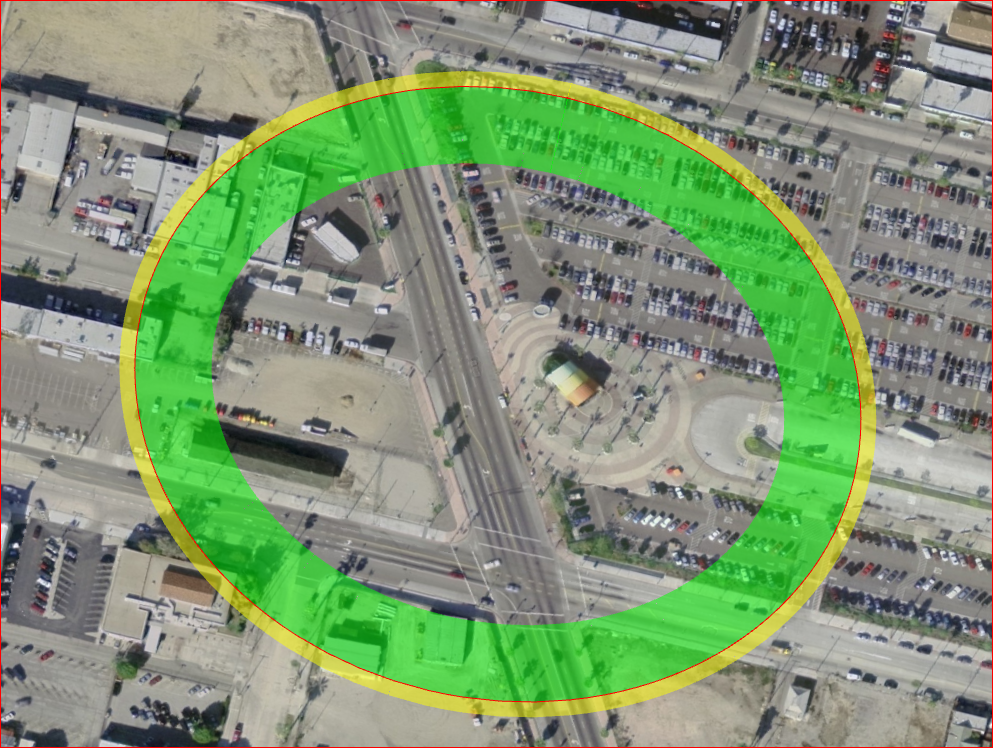
This code paints a closed shape with an inner border with a 100-foot width, an outer border with a 20-foot width, and a 1-pixel wide outline:
var UOM_FOOT = UnitOfMeasureRegistry.getUnitOfMeasure("Foot");
geocanvas.drawShape(shape, {
  stroke: {
    color: "red",
    width: 1
  },
  innerBorder: {
    color: "rgba(0,255,0,0.5)",
    uom: UOM_FOOT,
    width: 100
  },
  outerBorder: {
    color: "rgba(255,255,0,0.5)",
    uom: UOM_FOOT,
    width: 20
  }
});
[source, javascript, linenums,indent=0]
The result of painting a circle with borders expressed in world units is:
Using The Symbology Encoding painter
LuciadRIA reads the optional gml:uom attribute included in LineSymbolizer and PolygonSymbolizer elements in XML Symbology Encoding stylesheets.
This unit of measure value applies to all elements included in a Symbolizer to style lines and outlines of closed shapes. If you don’t set a unit of measure inside of Symbolizer, all units are measured in pixels.
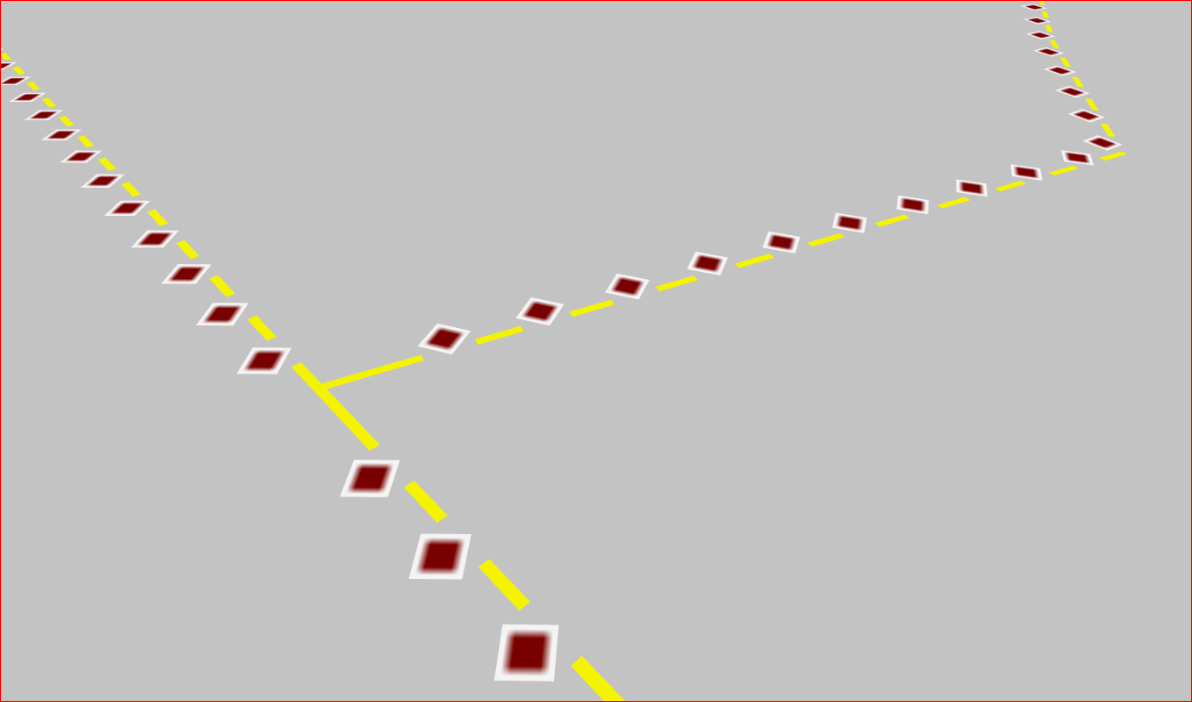
This is an example of an SE style definition that paints a Polyline shape with repeated image icons. The size of the icons is expressed in meters. The style definition displaces the icons vertically
from the center of the line by a distance, also expressed in meters. The gap distances between the images and the stroke width
are in meters as well.
<?xml version='1.0' encoding='UTF-8'?>
<FeatureTypeStyle xmlns="http://www.opengis.net/se" xmlns:ogc="http://www.opengis.net/ogc" xmlns:xsd="http://www.w3.org/2001/XMLSchema" xmlns:gml="http://www.opengis.net/gml" xmlns:xlink="http://www.w3.org/1999/xlink" xmlns:xsi="http://www.w3.org/2001/XMLSchema-instance" xsi:schemaLocation="http://www.opengis.net/ogc http://schemas.opengis.net/filter/1.1.0/filter.xsd http://www.w3.org/2001/XMLSchema http://www.w3.org/2001/XMLSchema.xsd http://www.opengis.net/se http://schemas.opengis.net/se/1.1.0/FeatureStyle.xsd http://www.opengis.net/gml http://schemas.opengis.net/gml/3.1.1/base/gml.xsd http://www.w3.org/1999/xlink http://www.w3.org/1999/xlink.xsd " version="1.1.0">
  <Description>
    <Title>US rail roads</Title>
  </Description>
  <Rule>
    <LineSymbolizer uom="http://www.opengeospatial.org/se/units/meter">
      <Stroke>
        <SvgParameter name="stroke">#FFFF00</SvgParameter>
        <SvgParameter name="stroke-width">10</SvgParameter>
       <GraphicStroke>
          <Graphic>
            <ExternalGraphic>
              <InlineContent encoding="base64">iVBORw0KGgoAAAANSUhEUgAAAAYAAAAGCAYAAADgzO9IAAAAHklEQVQIW2P8DwQMWAAjSKKOkRFFqgmoltoS2CwHACVQI+/9x0Y+AAAAAElFTkSuQmCC</InlineContent>
              <Format>image/png</Format>
            </ExternalGraphic>
            <Size>40</Size>
            <Rotation>45</Rotation>
            <Displacement>
              <DisplacementX>0</DisplacementX>
              <DisplacementY>-20</DisplacementY>
            </Displacement>
          </Graphic>
          <InitialGap>10</InitialGap>
          <Gap>50</Gap>
        </GraphicStroke>
      </Stroke>
     </LineSymbolizer>
  </Rule>
</FeatureTypeStyle>
In LuciadRIA, you use the ogc/se/SEPainterFactory to create a new FeaturePainter from the SE styling document. Once you have the painter, you can create a FeatureLayer to style the data in the model.
SEPainterFactory.createPainterFromURL("path/to/style.xml")
    .then(function(sePainter) {
          //the painter is ready. We can now create a layer.
          var featureLayer = new FeatureLayer(featureModel, {painter: sePainter});
    });
The result of drawing polylines with the SE style definition is: