The visualization of S-101 Electronic Navigational Charts (ENC) is governed by specific components mandated within the S-101 Product Specification. The standards themselves are defined and maintained by the International Hydrographic Organization (IHO) and its associated working groups. The specification defines a number of settings the user can control for customizing the display of S-101 ENCs.
The table below summarizes the key display settings available for S-101 data visualization :
| Setting | Description |
|---|---|
|
|
Controls the display mode for the chart, determining which feature categories and viewing group layers are visible. Three modes are available:
|
|
|
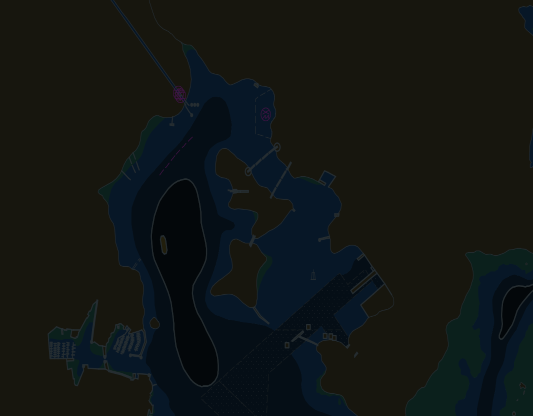
Specifies the color scheme used for rendering: Day, Dusk, or Night modes. Affects visibility under different lighting conditions. |
|
|
Depth value (in meters) that defines the safety contour line. Areas shallower than this value are highlighted as potentially hazardous. |
|
|
Depth value (in meters) that defines the deep contour line. Areas deeper than this value are rendered differently for navigation purposes. |
|
|
Controls which display planes are active for rendering chart features relative to radar imagery. Display planes determine the layering order of chart content in ECDIS systems, allowing features to be positioned either above or below the radar display. Two planes are available:
Multiple display planes can be active simultaneously, providing flexible control over which feature categories appear above or below radar imagery based on their navigational importance. |
|
|
Depth value (in meters) below which soundings are emphasized. Used to identify safe water depths for vessel navigation. |
|
|
Depth value (in meters) that defines the shallow contour line. Distinguishes shallow areas from deeper waters. |
|
|
Boolean flag to enable and disable highlighting of dangers in shallow water areas for enhanced safety awareness. |
|
|
Boolean flag to toggle between plain or symbolized boundaries for areas and zones on the chart. |
|
|
Boolean flag to enable two-color shading for depth areas instead of multiple color gradations. |
|
|
Boolean flag to control whether light sector lines are shown in full or simplified representation. |
|
|
Boolean flag to use simplified symbols for features instead of detailed paper-chart symbols. |
|
|
Boolean flag to show visual indication when the chart is displayed at a larger scale than recommended. |
|
|
Boolean flag to show visual indication when the chart is displayed at a smaller scale than recommended. |
|
|
Boolean flag to bypass minimum scale restrictions and display chart data regardless of zoom level. |
|
|
Color used to highlight areas when the chart is displayed below its recommended scale. |
|
|
Boolean flag to enable radar overlay mode, which adjusts colors and styling for integration with radar displays. |
|
|
String value specifying the preferred language for rendering texts on the chart. |
|
|
Specifies which S-101 viewing group layers are visible on the chart. Each layer represents a category of chart features:
|
These settings are available in the TLcdS101DisplaySettings class.
For example to switch to night settings, you use:
s101DisplaySettings.setColorPalette(ELcdS101ColorPalette.NIGHT);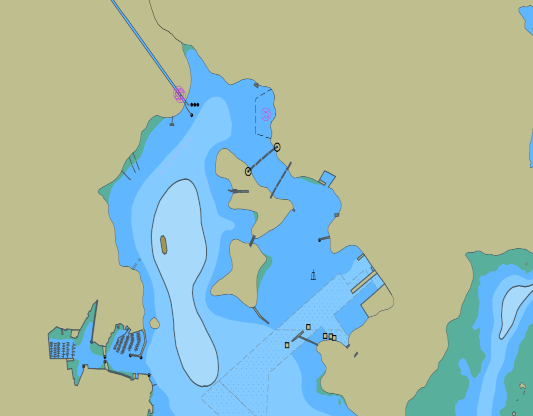
To apply those settings on your layer, you set them on the layer factory before layer creation.
TLcdS101DisplaySettings s101DisplaySettings = new TLcdS101DisplaySettings();
s101DisplaySettings.setDisplayMode(ELcdS101DisplayMode.STANDARD);
s101DisplaySettings.setSafetyDepth(5.0);
S101GXYLayerFactory layerFactory = new S101GXYLayerFactory();
layerFactory.setDisplaySettings(s101DisplaySettings);
ILcdGXYLayer layer = layerFactory.createGXYLayer(model);
In a typical application, you have a single TLcdS101DisplaySettings instance which is shared by all layers.
This ensures that when you, or an application user, changes the display settings, the changes are applied to all layers.
|
In the sample, you can change the display settings in a UI panel.
See the |