What happens?
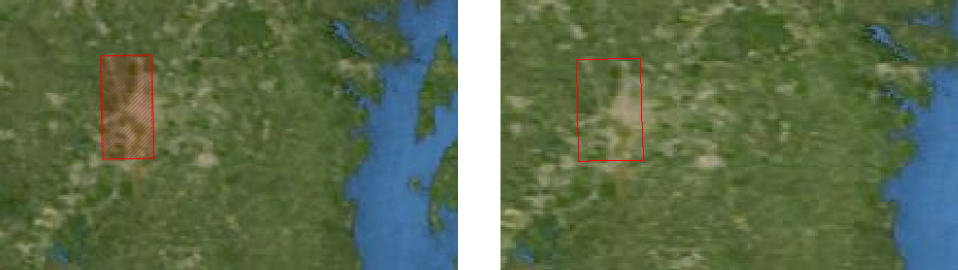
Your imagery layer displays a red hatched rectangle (Lightspeed view) or an outlined red rectangle (GXY view) instead of any actual imagery data. You see this rectangular box when you have zoomed out to a fair distance from the data.
Why does this happen?
The red rectangle is a placeholder for the actual data, and indicates the position of the data on the map. The placeholder protects you from loading too much imagery data.
Suppose that you have a 100 MB imagery file that covers a small city, a GeoTIFF file for instance. You load the file on your map while you’re zoomed out far enough to see an entire continent. At that point, the area covered by the image corresponds to only a small portion of your screen, say 20x20 px (pixels). To render those 20x20 pixels, the rendering engine would have to load the whole file - 100 MB. If that were the only thing it had to do, fine, but you probably have lots of other data sets to handle as well. Moreover, you wouldn’t be able to see any meaningful detail of the imagery from that zooming distance.
Therefore, default LuciadLightspeed settings prevent the data from loading. A placeholder rectangle is displayed rather than the actual data. The trade-off between either loading the data or showing the placeholder is referred to as the start resolution factor. This factor describes the relation between:
-
The amount of data that has to be loaded from disk. For example, 30.000 x 30.000 px = 900 million px (~ a 100 MB GeoTIFF file).
-
The amount of data that can be shown on your screen. For example, 20 x 20 = 400 px.
If this factor is too large (2.25 million in the example - that’s huge), loading the data is considered a wasteful operation and the placeholder is shown.
How can I prevent this?
To make the rectangle go away and see your imagery, you have a couple of options :
Simply zoom in
As you zoom in, your imagery data will become visible. Suppose you zoom to the street level of the city imagery file. Your entire view now contains relevant data, 1000 x 1000 px for instance, while you see just a small portion of the data, namely the part that surrounds the street you’re looking at. Remember, the file covers an entire city. So let’s say the rendering engine now only has to load 3000 x 3000 px from the data. That means the start resolution factor (3000x3000) / (1000x1000) becomes 9, a much more realistic value. Loading the data makes sense now.
Use multi-leveled imagery data
Instead of using a single, huge 30.000 x 30.000 px image, you store additional lower-resolution images in the same file. You add a 10.000 x 10.000 px image and a 3000 x 3000 px image, for example. The rendering engine automatically picks the most appropriate level for the zoom level of the map user, so multi-leveling an image can drastically increase efficiency. If the rendering engine can use the 3000 x 3000 image instead of the 30.000 x 30.000 image, it is 100 times more efficient. The more levels you provide, the more efficient it can be. Data sets covering the entire world, such as Bing maps imagery, have over 20 levels. Common imagery formats such as GeoTIFF support this so-called multi-leveling, while others such as PNG or JPG do not. See Using GDAL to convert your image to a multi-level image for more detailed instructions.
Increase the start resolution factor
The type of your view determines how you can increase the start resolution factor:
-
GXY views: see
TLcdGXYImagePainter.getStartResolutionFactor() -
Lightspeed views: see
TLspRasterStyle.getStartResolutionFactor() -
GXY layers in Lucy: select the checkbox Force painting in the Layer properties panel, and ensure that the layer is always painted.
Use an SLD style with appropriate scale ranges
The SLD style definition below uses a very large maximum scale denominator to make sure that the raster data is visible at
any realistic map scale. It can be saved as an XML file and used to style a raster layer:
* In GXY views. See TLcdSLDGXYLayerFactory for more information.
* In Lightspeed views. See TLspSLDStyler or TLspRasterLayer.configureForSLDStyling() for more information.
* In Lightspeed layers in Lucy: Lucy automatically picks up and applies SLD style files in the same folder, if they have the
same name as the data set and an .sld extension.
<?xml version='1.0' encoding='UTF-8'?>
<FeatureTypeStyle xmlns="http://www.opengis.net/se" xmlns:xsi="http://www.w3.org/2001/XMLSchema-instance"
                  xsi:schemaLocation="http://www.opengis.net/se http://schemas.opengis.net/se/1.1.0/FeatureStyle.xsd"
                  version="1.1.0">
  <Name>Style to make raster data always visible</Name>
  <Rule>
    <Name>raster_always_visible_rule</Name>
    <!-- The following max scale denominator has a large value to make sure that the raster data is visible at any realistic map scale; please note however that this can cause performance issues if the raster data is not optimized to be visualized at all scales. The raster data is sub-optimal if its resolution is too high and if it does not have multiple levels of detail. -->
    <MaxScaleDenominator>1000000000000</MaxScaleDenominator>
    <RasterSymbolizer/>
  </Rule>
</FeatureTypeStyle>
How can I prevent this for a WM(T)S service created with LuciadFusion Studio ?
The same overload protection mechanism is active in a WMS or WMTS service created from LuciadFusion Studio. As a result, a WM(T)S client, such as a LuciadRIA application, can show a red (hatched) rectangle for an imagery layer when the user zooms out of the map.
The recommended solution, which does not require any coding, is to convert your imagery data to multi-leveled data, and serve that data instead. For example, for a GeoTIFF file, you have two options to convert it to multi-leveled data:
-
Use the Data Connectivity Manager to fuse your TIFF file into a LuciadFusion coverage. Once you converted the TIFF file into a coverage, you need to update the WM(T)S service to serve this coverage.
If you do not want to use multi-leveled data, you can also use one of the following options:
-
Use an SLD file to force the TIFF file to be visible over a certain scale range, as explained above.
-
Plug in a custom layer factory in LuciadFusion that uses an adjusted startResolutionFactor, as explained above.
The latter two options have the major drawback that they load a lot of data into memory, possibly leading to instances of
OutOfMemoryException.
Using GDAL to convert your image to a multi-level image
GDAL is an open-source GIS library that can be used to convert an image to a multi-leveled, tiled and compressed image. Such images provide the best possible performance when they are visualized in a LuciadLightspeed application, or when they are served over WMS through LuciadFusion. You can optimize color images as well as measurement images with GDAL.
Optimizing a color image
If your image contains colors, you can use the following GDAL code:
gdal_translate -co compress=jpeg -co tiled=yes -co blockxsize=256 -co blockysize=256 ${INPUT_FILE} ${OUTPUT_FILE}
gdaladdo -r average ${OUTPUT_FILE} 2 4 8 16
-
gdal_translate is used to tile and compress the data. In the above example, we use JPEG compression and tile the data in 256 x 256 tiles.
-
gdaladdo is used to add overview levels to an existing file.
-
The additional levels take the average of pixels, for smooth results.
-
We generate 4 additional levels, for example, to have 5 in total. The resolutions are 1/2, 1/4, 1/8, 1/16 along each dimension.The number of pixels goes down by a factor of 4.
-
A good choice for the number of levels is: log2(total_resolution/desired_resolution).
For example, for an image of 10kx10k: log2(10k/1024) = 3.3 → 3 or 4 levels in total.
-
Optimizing a measurement image
If your image contains measurement values, such as elevation data, multi-band data, and hyperspectral data, you can use this GDAL code:
gdal_translate -co compress=LZW -co predictor=2 -co tiled= yes -co blockxsize=128 -co blockysize=128 ${INPUT_FILE} ${OUTPUT_FILE}
gdaladdo -r nearest ${OUTPUT_FILE} 2 4 8 16
-
gdal_translate is used to tile and compress the data. In the above example, we use LZW compression and tile the data in 128 x 128 tiles.
-
gdaladdo is used to add overview levels to an existing file.
-
The additional levels take the nearest of pixels. This approach results in more aliasing, but prevents interpolating values.
-
We generate 4 additional levels, for example, to have 5 in total. The resolutions are 1/2, 1/4, 1/8, 1/16 along each dimension. The number of pixels goes down by a factor of 4.
-
A good choice for the number of levels is: log2(total_resolution/desired_resolution).
For example, for an image of 10kx10k: log2(10k/1024) = 3.3 → 3 or 4 levels in total.
-