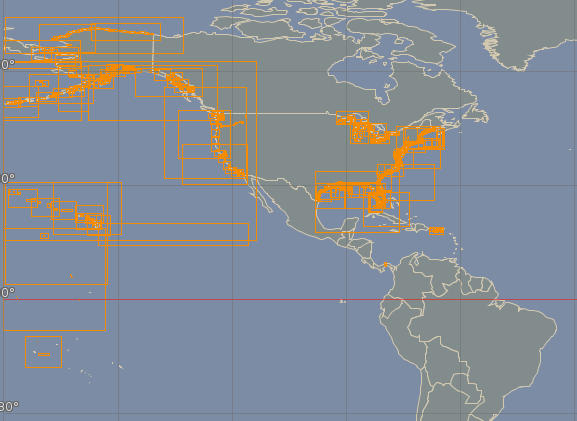
When visualizing ECDIS data, it can be that:
-
Only the bounds of a cell are shown, instead of its contents
-
The cell contents is shown but covered with a hatch pattern of lines
This is the over and underscale protection mechanism that you see. Each ECDIS cell was designed to be visualized in a specific scale-range:
-
When zoomed out: if all data would be shown, the application would run out of memory. Therefore the bounds of the cell are shown instead of its contents.
-
When zoomed in: the data might not be precise/accurate enough for that zoom-level, resulting in for example missing objects. To make the user aware of this, the cell contents is covered with lines.
This behavior can be turned on/off on the TLcdS52DisplaySettings class:
see the setDisplayOverscaleIndication, setDisplayUnderscaleIndication and setUnderscaleIndicationColor.