The visual quality and performance of your point cloud display depends on various factors:
-
The number of points loaded.
-
More points mean more detail. If there are more points, you can have smaller dot sizes.
-
More points can also lead to lower fluency and performance.
-
-
The size of the dots on screen.
-
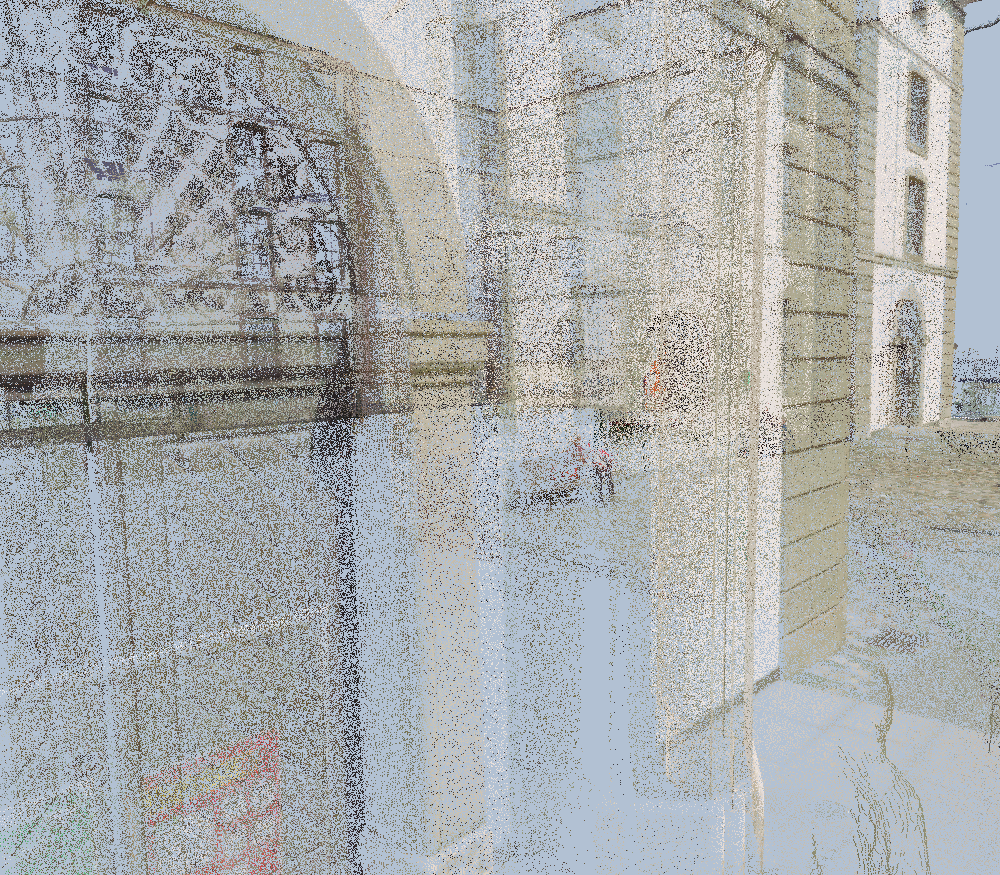
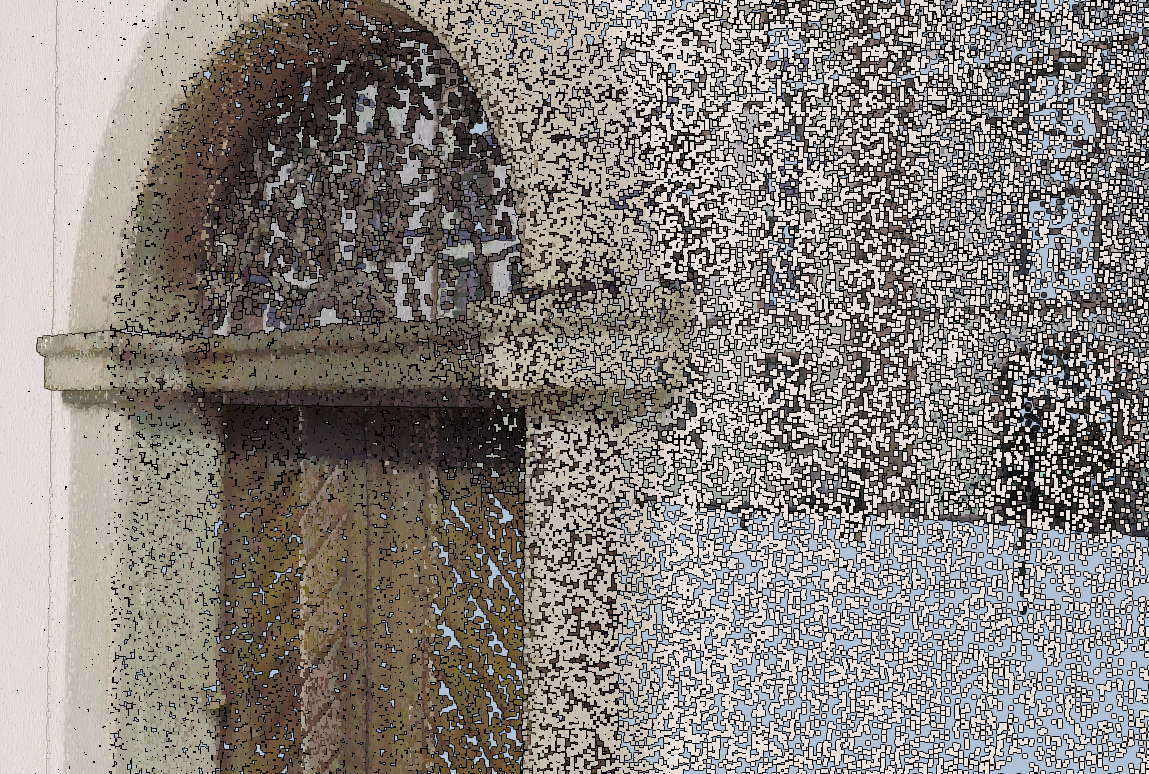
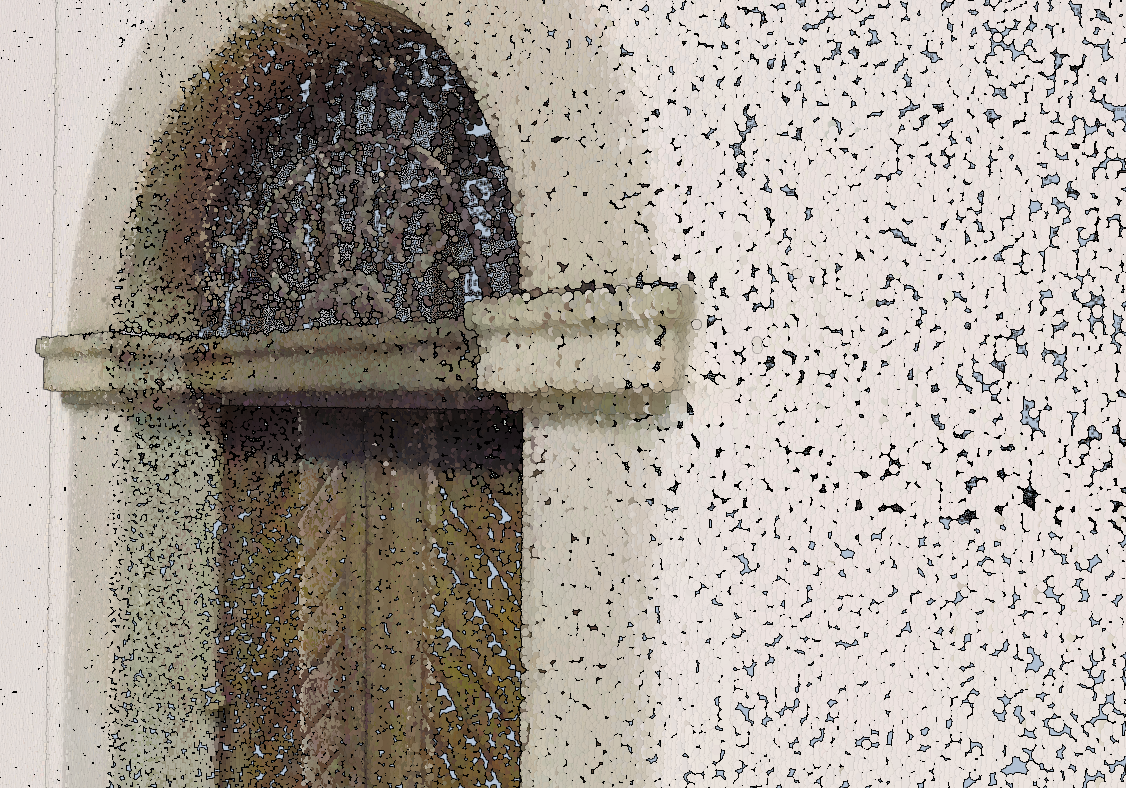
Smaller dots give you better detail if you have enough point density, but can result in a sparse point cloud if your density is low.
-
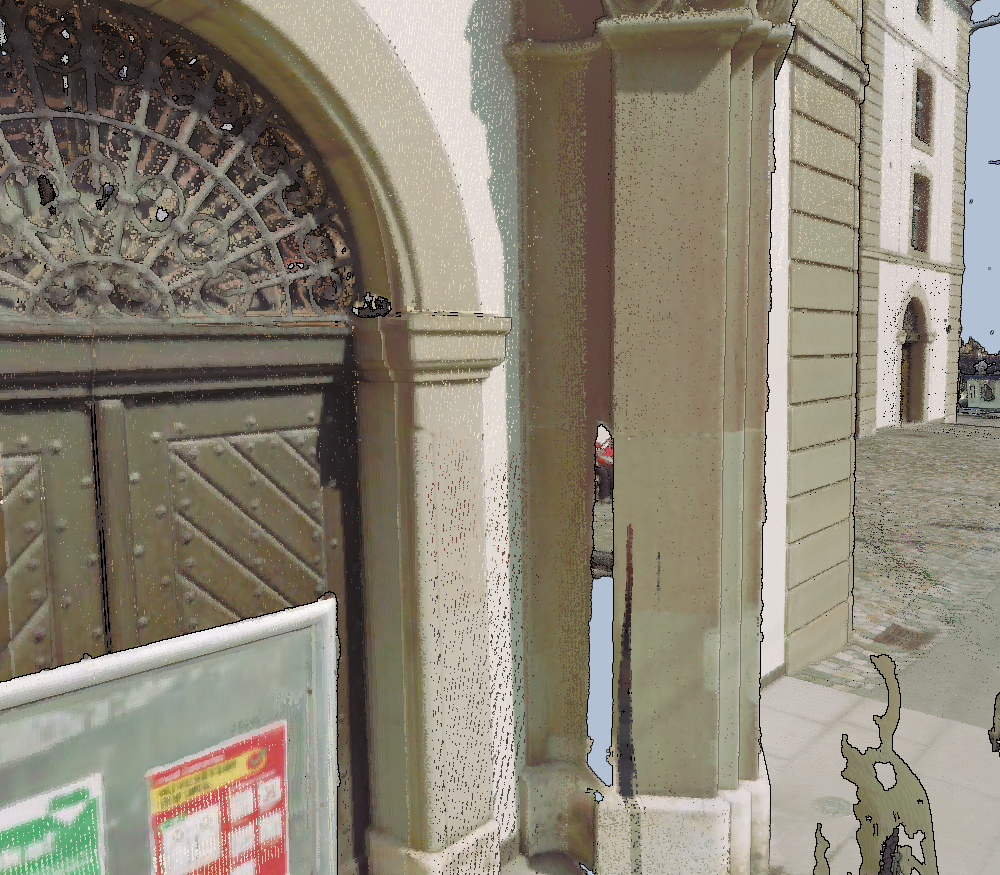
Larger dots give you a visually closed surface, but can cause an impression of lower detail and lower performance.
-
-
Other visual effect settings. The graphic effect settings on the map can have a major impact on visual presentation.
LuciadCPillar does its best to find a good balance between these factors. It also offers various options to optimize visual quality and performance for your dataset, hardware, and use case.
Recommended settings
To get the best visualization out of your point clouds, you can configure various options
You can find detailed descriptions of all the settings further on. In this section, you can find our recommendation based on some usage profiles.
| Type | Quality factor | Point size | Usage |
|---|---|---|---|
|
Low |
|
Point size adaptive |
Mobile devices |
|
Medium |
|
Point size adaptive |
High-end phones & tablets, low-end laptops |
|
High |
|
Point size adaptive |
Mid-range laptops |
|
Ultra |
|
Point size adaptive |
Laptops with gaming hardware |
auto pointCloudStyle = PointCloudStyle::newBuilder().pointSizeAdaptive().build();
auto layer = TileSet3DLayer::newBuilder().model(model).qualityFactor(1.5).pointCloudStyle(pointCloudStyle).build();
var pointCloudStyle = PointCloudStyle.NewBuilder().PointSizeAdaptive().Build();
var layer = TileSet3DLayer.NewBuilder().Model(model).QualityFactor(1.5).PointCloudStyle(pointCloudStyle).Build();var pointCloudStyle = PointCloudStyle.newBuilder().pointSizeAdaptive().build();
var layer = TileSet3DLayer.newBuilder().model(model).qualityFactor(1.5).pointCloudStyle(pointCloudStyle).build();Detailed settings information
Choosing the right point size
LuciadCPillar offers dot size modes for point clouds. For more details, see PointCloudStyle::BuilderPointCloudStyle::BuilderPointCloudStyle::Builder.
Using pixel-size mode
In this mode, you specify the dot size in pixelsin pixelsin pixels. All dots have the same size in pixels.
This mode works well for point clouds with additive refinement, such as HSPC.
Using world-size mode
In this mode, you specify a dot size in metersin metersin meters. LuciadCPillar computes the dot size in pixels. Dots closer to the viewer will be larger than points further away.
This mode helps you maintain a visually closed surface when zooming in close to the data, and retain details further away.
You can also specify a minimum point sizeminimum point sizeminimum point size.
Use this mode if you know the rough inter-point distance in your dataset.
Using adaptive world-size mode
In this mode, LuciadCPillar deduces a dot size in meters per tilein meters per tilein meters per tile.
With this mode, your aim is to display the right amount of detail at all times, no matter if you are close to the data or further away.
You can also specify a minimum point sizeminimum point sizeminimum point size.
This mode is the default recommended setting for all point clouds. Use this mode for HSPC point clouds or for point clouds produced by LuciadFusion.
Adjusting the number of points loaded
LuciadCPillar uses the scale information present in the source data to determine what tiles and level-of-detail to load at any given moment.
Sometimes the scale information in datasets isn’t well-configured though, making it difficult to choose the right level.
You can adjust the amount of detail loaded using the qualityFactorqualityFactorqualityFactor settings on TileSet3DLayerTileSet3DLayerTileSet3DLayer.
The default is 1.0. Increasing the value results in the loading of more data and detail. Decreasing the value reduces the amount of data.
These are our recommendations for use of the quality factor:
-
If you see sparse points, visible edges between tiles of different level-of-detail, or visible switches in level-of-detail when you are navigating, increase the
qualityFactor. -
If you experience bad performance, or your application starts using too much memory, decrease the
qualityFactor.
Using map graphics effects
The map effect eye-dome lighting can significantly enhance the visual depth perception of your point cloud.
See How to configure Map effects for more information.
Working with transparency
If your colorExpressioncolorExpressioncolorExpression adds transparency to your point cloud, you must tell the layer to take this into account.
See Showing transparent colors on meshes or point clouds for more information.